- SPX Monitoring purposes, Sold SPX 3/28/19 & 2815.44= gain .61%, Long 2798.36 & 3/25/19.
- Monitoring purposes Gold: Long VanEck Vectors Gold Miners ETF (NYSE:GDX) on 1/29/19 at 21.96.
- Long Term Trend SPX monitor purposes; Long SPX on 10-19-18 at 2767.78
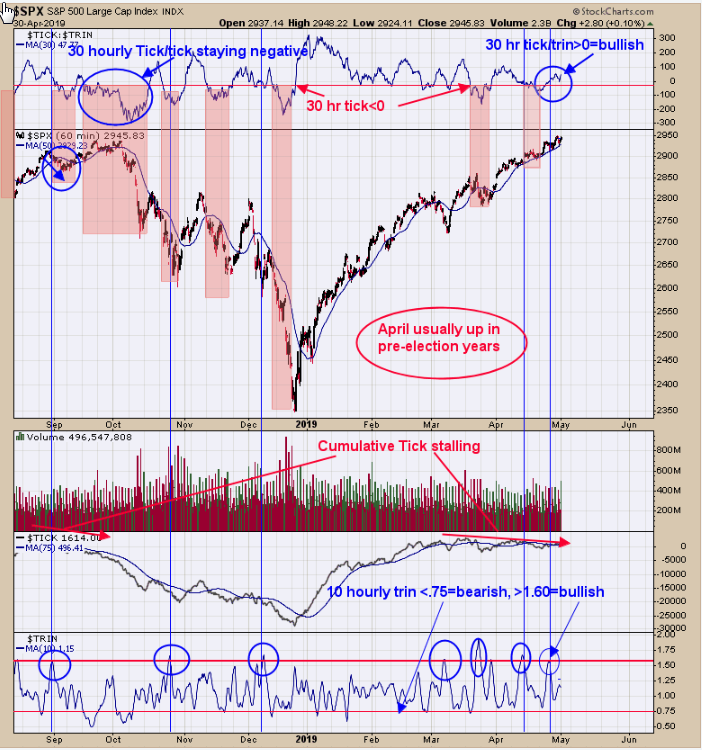
The top window is the hourly Tick/Trin ratio with a 30 period moving average. Readings above “0” on this indicator are a bullish sign for the market short term. When this indicator falls below “0” a bearish sign is triggered. The readings below “0” have been noted with tan shaded areas. The second window up from the bottom is the hourly cumulative tick which has been making lower highs as the SPX has been making higher highs which is a divergence. The same development happen back at the September 2018 highs; however we are not looking for a big decline here but a 5% or better pullback is a good bet in the coming weeks. We remain neutral short term and bullish longer term which may change in the coming days. Join us on twitter. @OrdOracle.
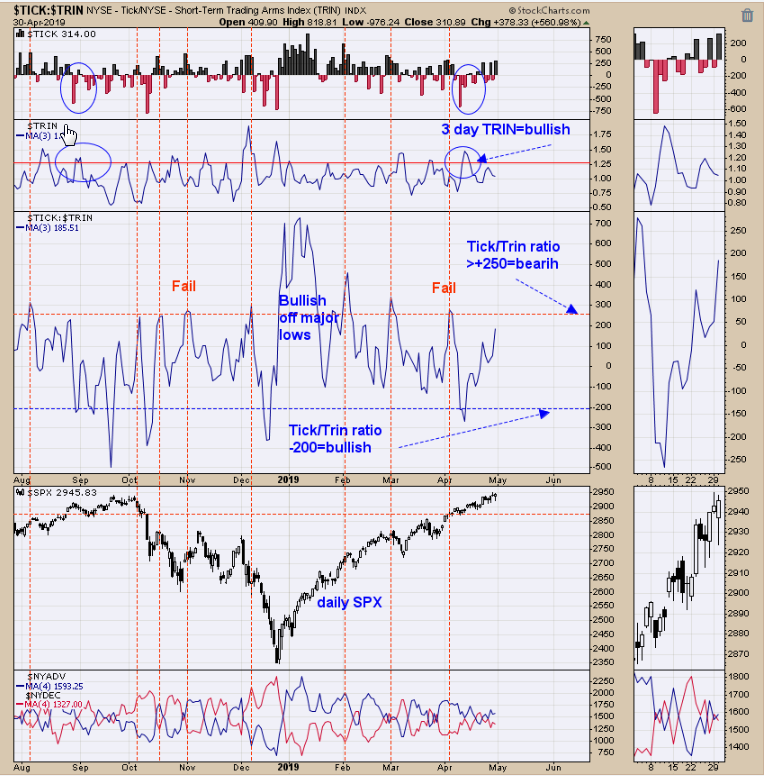
The middle chart is the daily Tick/Trin ratio with a 3 period moving average. This chart goes back 9 months. Short term highs have formed when the Tick/Trin ratio reached above +250 for 75% of the time. Fed day is tomorrow and could produce a reaction in the market. SPX is up against the 2018 highs and a resistance area. A high tick close with a low trin close could push the Tick/Trin ratio into bearish levels. We also noticed that the VIX has been making higher lows as the SPX has been making higher highs and a bearish short term sign. Trend is up for now but Fed day could have an affect on market short term. Follow us on twitter. @OrdOracle
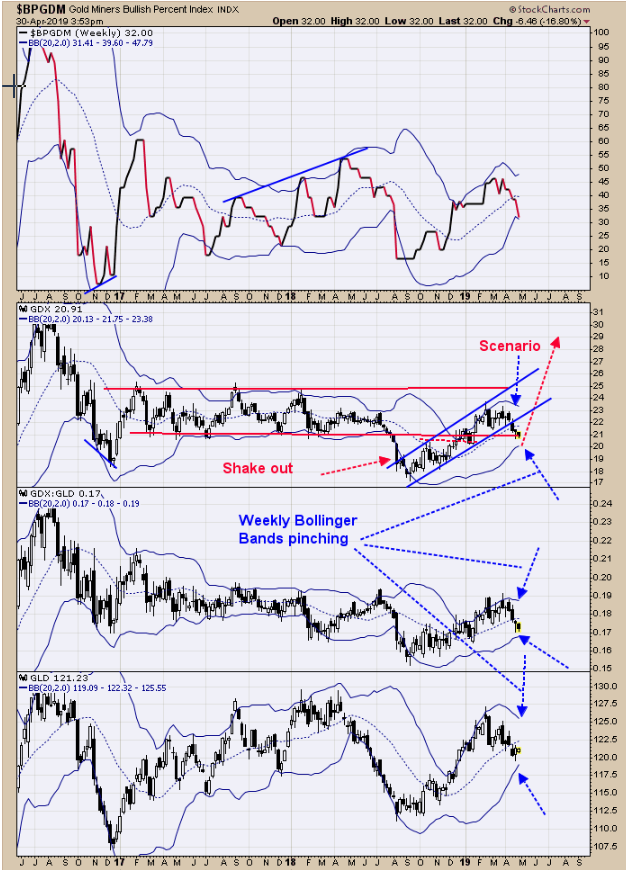
Notice that the Bollinger® bands are pinching on SPDR® Gold Shares (NYSE:GLD) (Bottom window), GDX/GLD (next window up) and GDX (next window up). Bollinger band pinching suggests increase volatility will be entering the market soon. We drew red parallel lines on the GDX chart to show support and resistance. GDX fell through support (near 21.00) back in August 2018 and than closed back above 21.00 in late 2018 creating a bullish “Shakeout”. GDX is back down near support again and we do expect this area will hold but could see a brief shot at 20.00 range before reversing higher. With the Bollinger bands pinching suggests the next move could be an impulse wave and with the “Shakeout” that move should be up. A time cycle low is also due now and helps the bullish outlook. Long GDX on 1/29/19 at 21.97. New Book release "The Secret Science of Price and Volume" by Timothy Ord.


