Trade war news continues to dominate headlines, and the stock market continues to fall with Treasury bond yields. Tech (particularly FANG) massively underperformed other indices today due to anti-trust news. Today’s headlines:
- Goldman Sachs (NYSE:GS) Bull/Bear Market Indicator is rolling over into a bear market?
- NASDAQ’s very quick drop into correction territory
- The collapse in Treasury yields continues
- Emerging markets are outperforming the U.S.
- Baltic Dry Index is going up
- Gold and silver spike

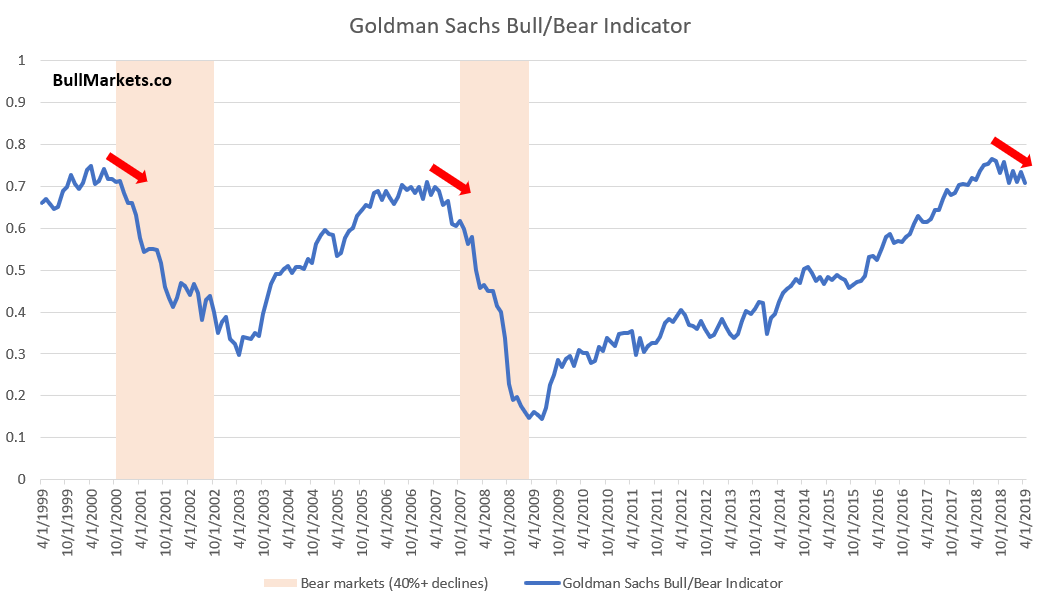
Goldman Sachs Bull/Bear Indicator
Goldman Sachs has a widely quoted Bull/Bear Indicator that takes the average percentile of 5 indicators:
- ISM
- Yield curve
- Core inflation
- Unemployment
- Shiller P/E
This indicator is starting to roll over because Shiller P/E, ISM, and core inflation are falling.

A high Bull/Bear Indicator doesn’t mean much, because like the Shiller P/E ratio, there’s no guarantee that it will peak until it has already peaked. (The same way how “overvalued” can become even more overvalued).
That’s why it’s better to look at when the Bull/Bear Indicator peaks and starts to roll over.
Here’s a chart for the past 20 years when the Bull/Bear Indicator’s 1-year rate-of-change turned negative, while still above 0.6.
We are no fans of recency bias, so here’s every case in which the Bull/Bear Indicator’s 1-year rate-of-change turned negative, while still above 0.6.
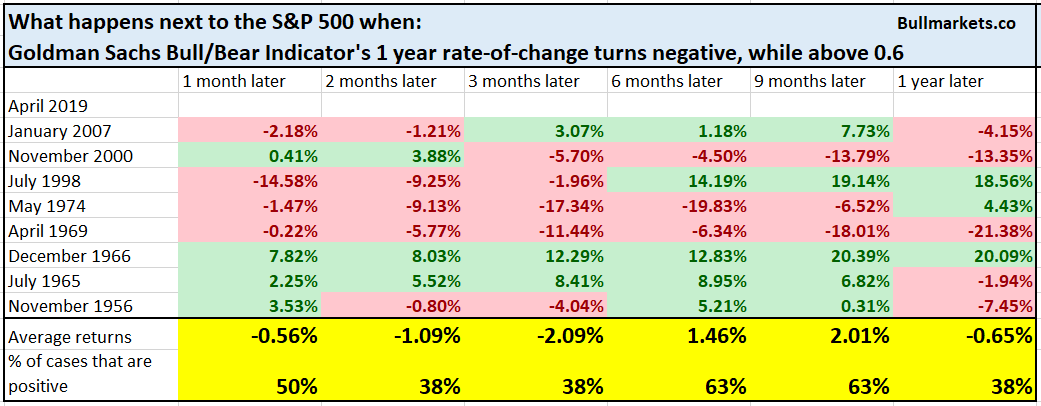
*The most recent reading uses economic data from April 2019, which was released throughout May 2019.
You can see that while this doesn’t always mark the bull market’s exact top, it certainly is late-cycle. Hence why the long term returns are worse than random.
NASDAQ
The NASDAQ has dropped straight into “correction territory” (-10%) after being at a 1 year high less than a month ago.
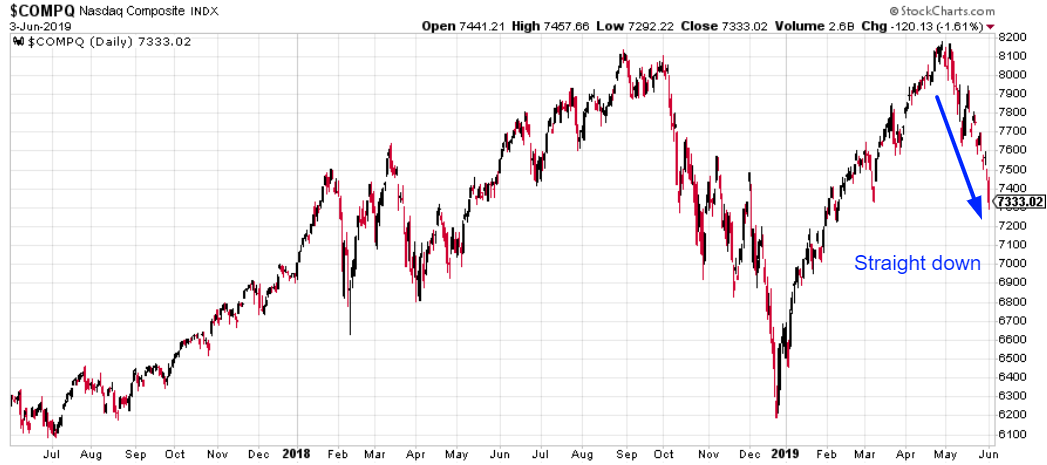
Here’s what happened next to the NASDAQ when it fell more than -10% from a 1 year high in less than 1 month.
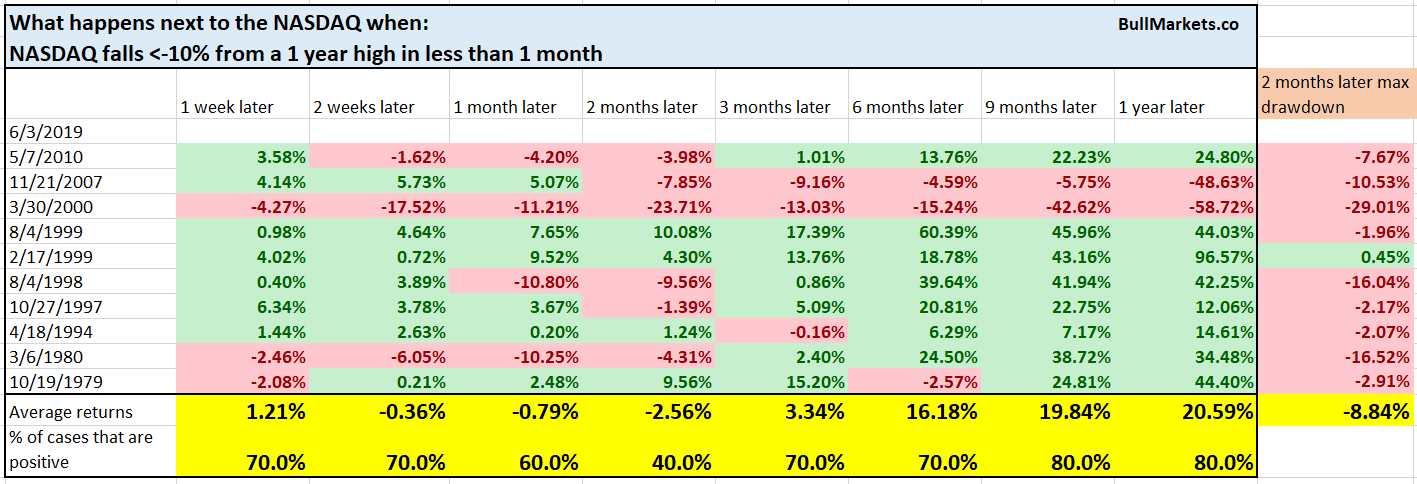
Historically, these quick drops often saw a bounce, and then a retest 2 months later. Some of the 2 month max drawdowns are quite big.
Treasury yields
Last Friday we looked at the extreme decline in 10 year Treasury yields and concluded that while yields could fall a little more in the short term, a bottom isn’t far.
*This is important because yields and stocks are moving together right now.
The “extreme decline” just got more extreme.
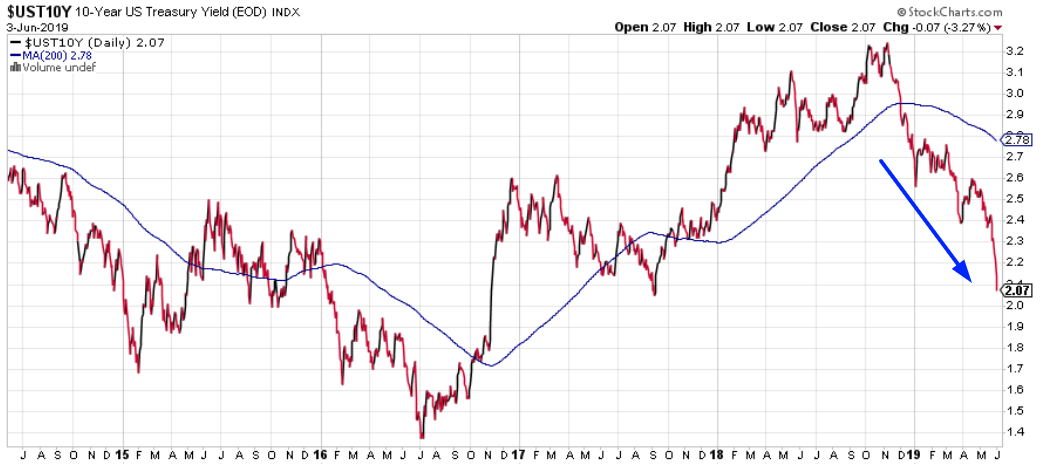
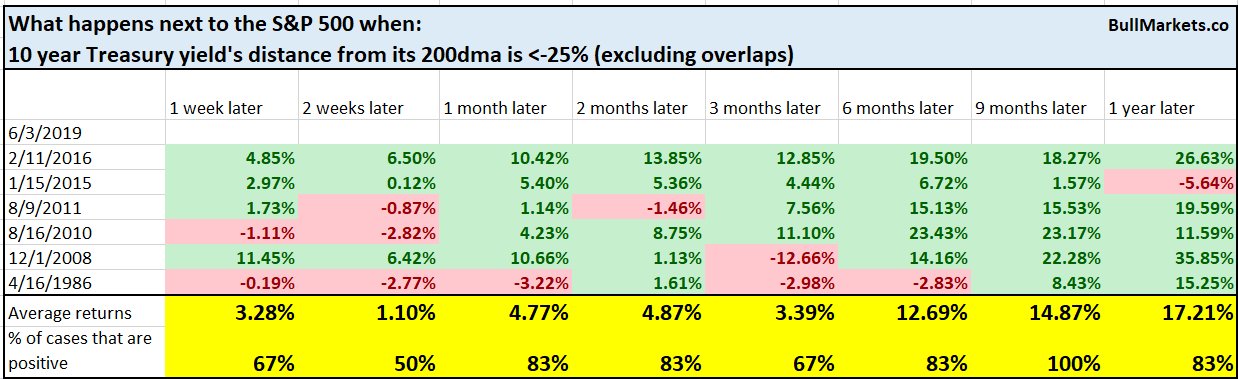
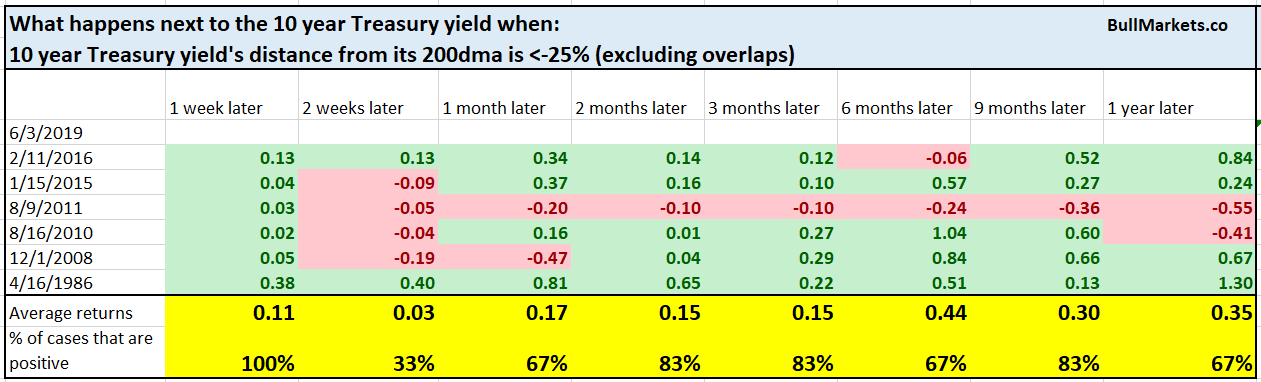
The 10 year Treasury yield is now more than -25% below its 200 dma.
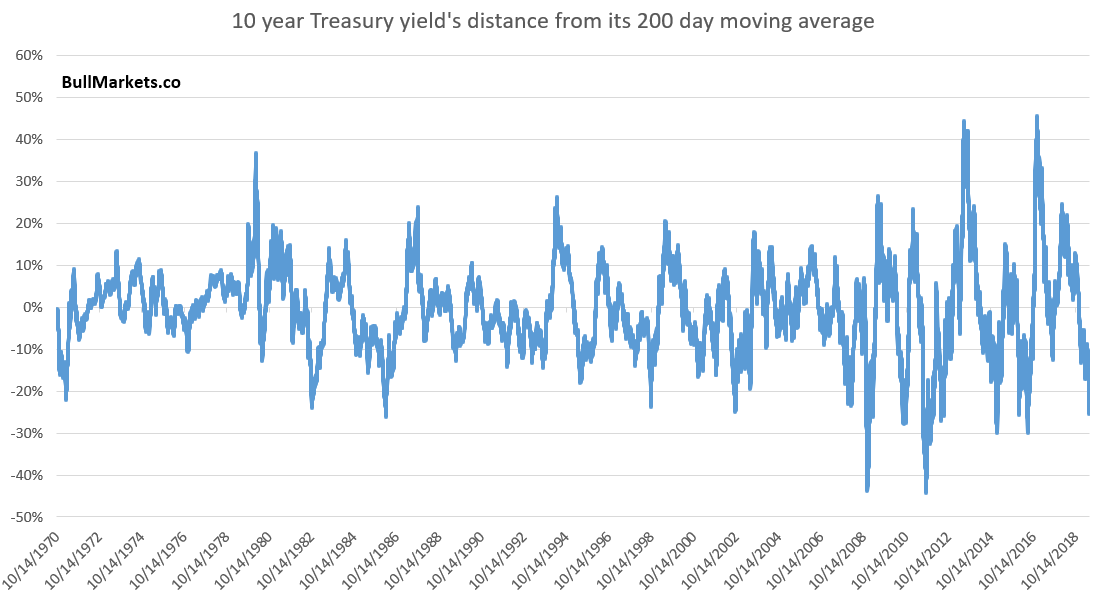
Similar historical cases were rare, due to how uncommon this is.
Here’s what happened next to the S&P:
Here’s what happened next to the 10 year Treasury yield:
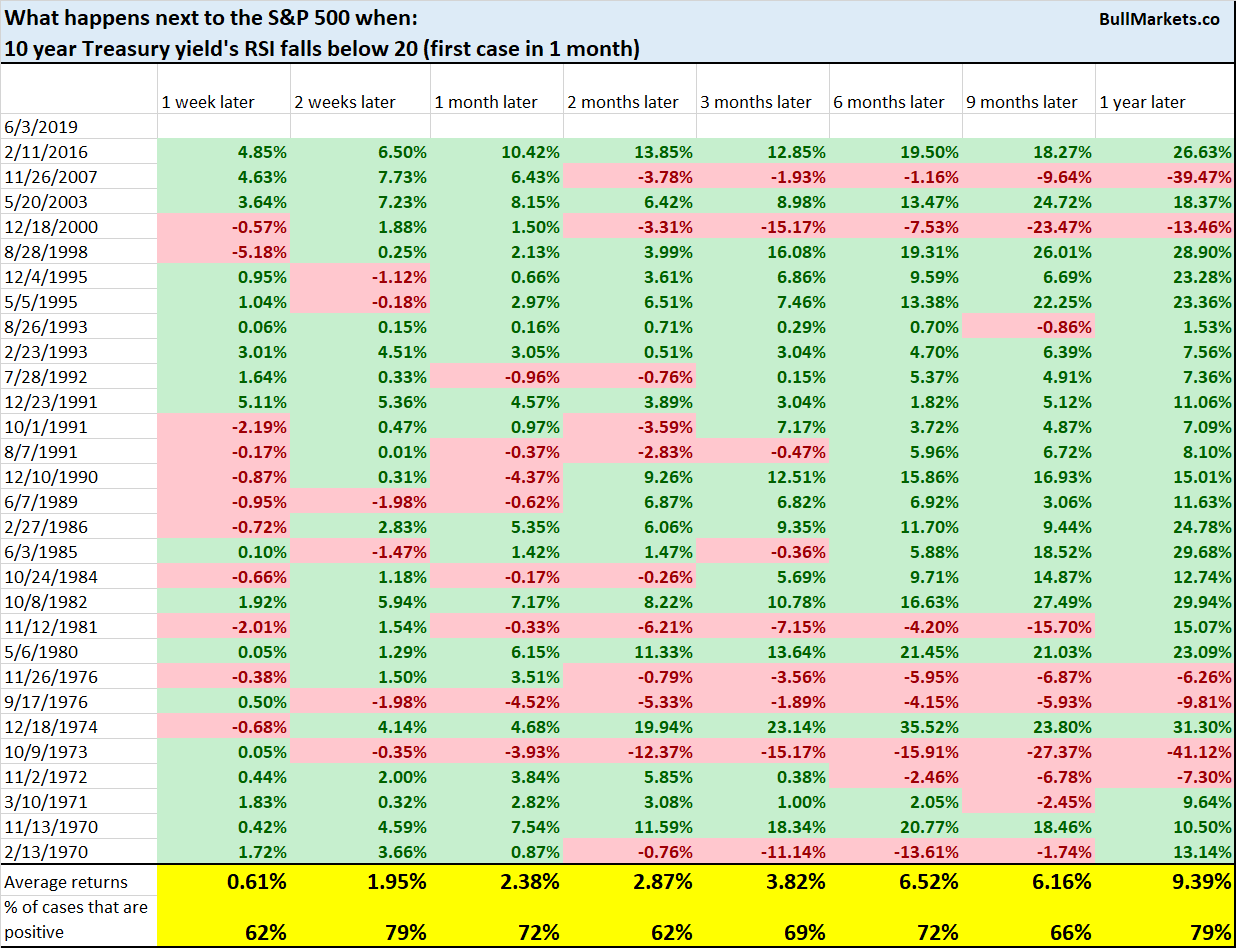
What if we want more sample sizes?
The 10-year yield’s RSI is now below 20. Historically, this was mostly bullish for the S&P 2 weeks later.

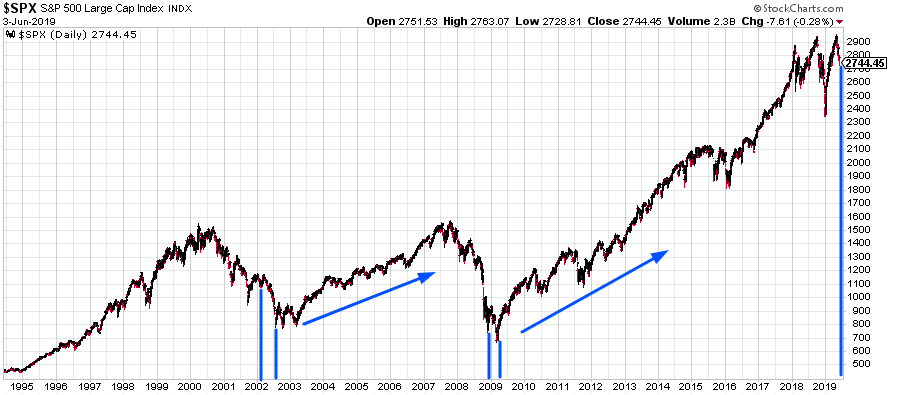
Emerging markets have significantly outperformed the U.S. over the past few days. Here’s EEM (emerging markets ETF) vs. the S&P.
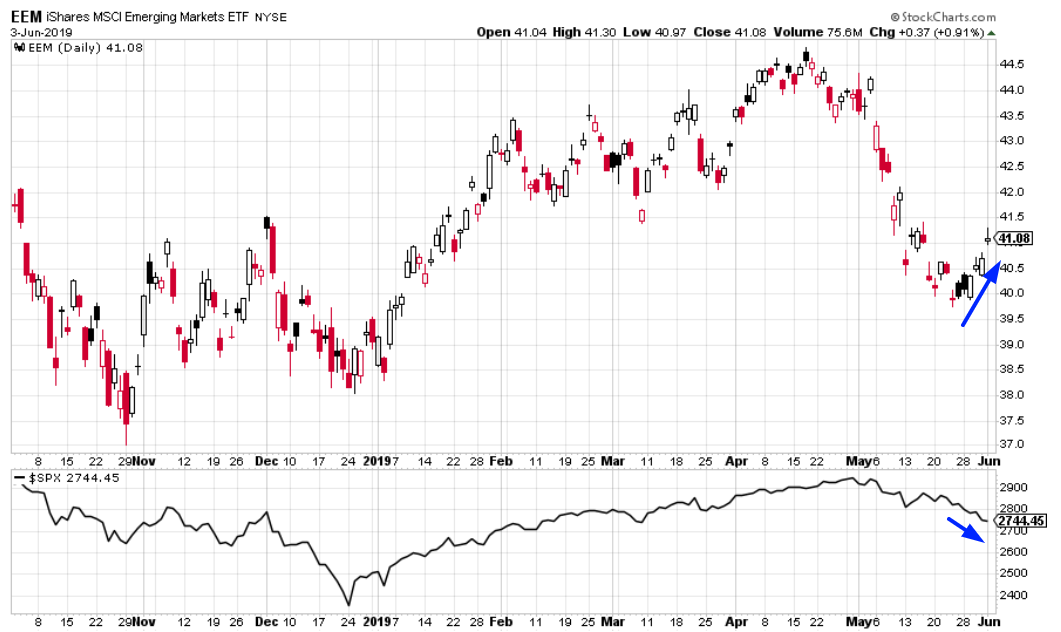
There are only 4 other historical cases in which EEM rallied more than +1.5% over the past 11 days while the S&P fell more than -4%.
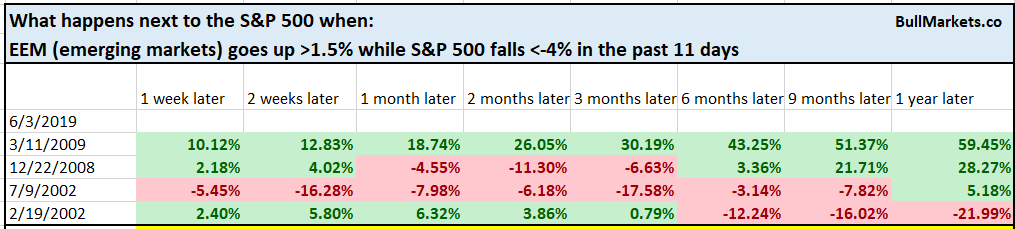
But you know the problem with low sample size charts and stats – you can find “evidence” to support whatever bias you have. (I see this quite often – people telling you why today is “just like 2008” while using a chart with a sample size of n=2).
To increase the sample size, let’s loosen the parameters.
Here’s what happens next to the S&P when EEM goes up while the S&P falls more than -3% over the past 11 days.
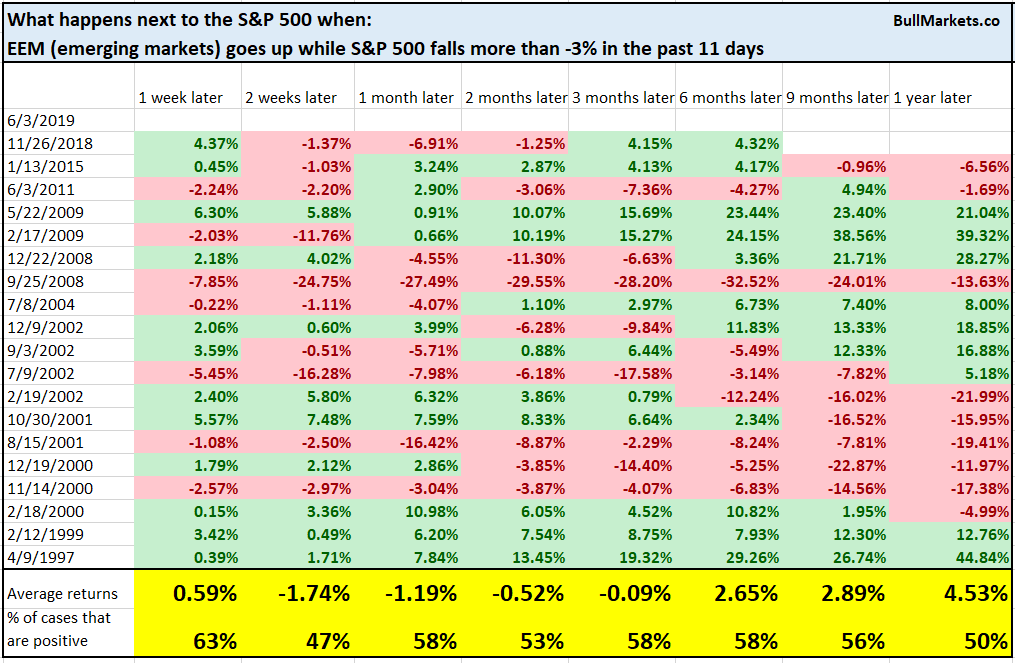
Slightly more bearish than random for the S&P on all time-frames.
Here’s what happens next to EEM.
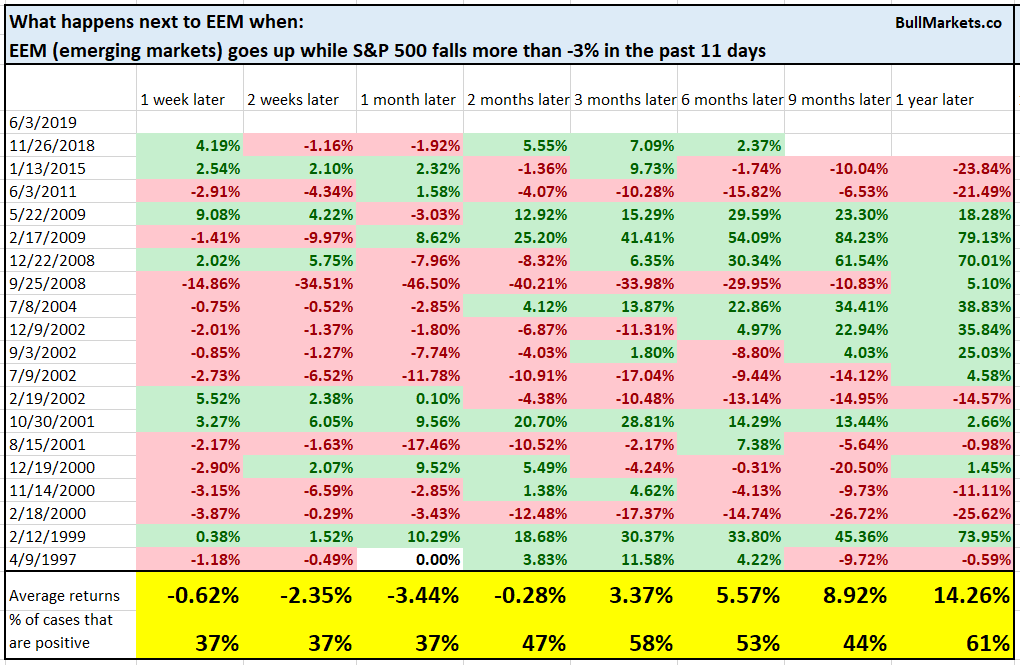
This is worse for emerging markets, particularly over the short term.
Baltic Dry Index
Last year a lot of people were using the collapsing Baltic Dry Index to predict an impending recession. Now that the Baltic Dry Index is rising, no one is talking about it. Bad news sells.
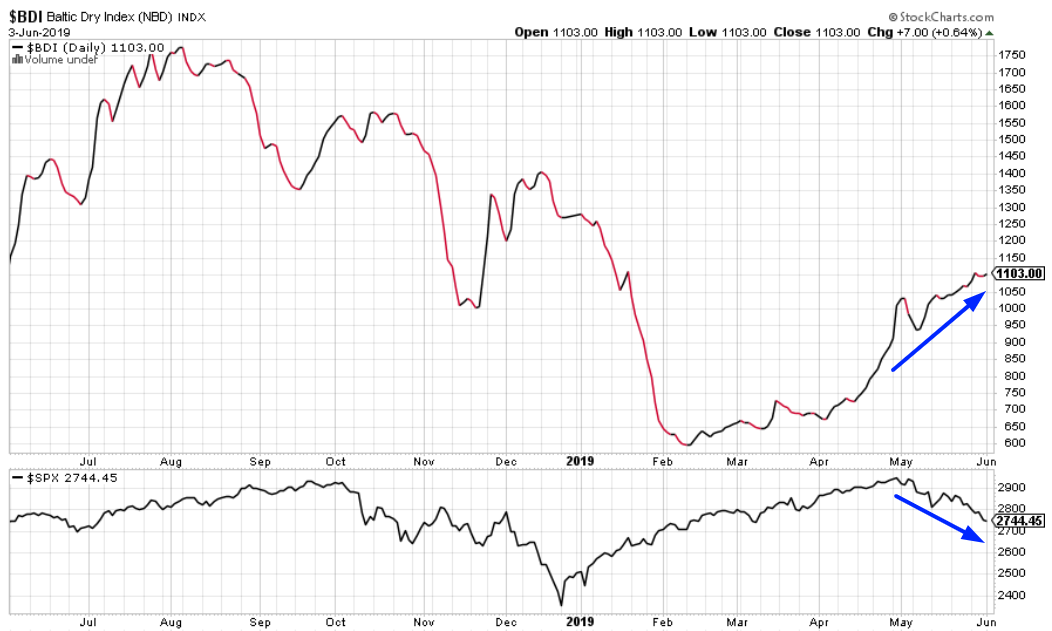
While the S&P is falling, the Baltic Dry Index continues to rally. If you subscribe to the theory that the Baltic Dry Index can show if “the economy is confirming the stock market”, here’s what happens when the S&P falls more than -5% in 1 month, while the Baltic Dry Index rises more than 10%.
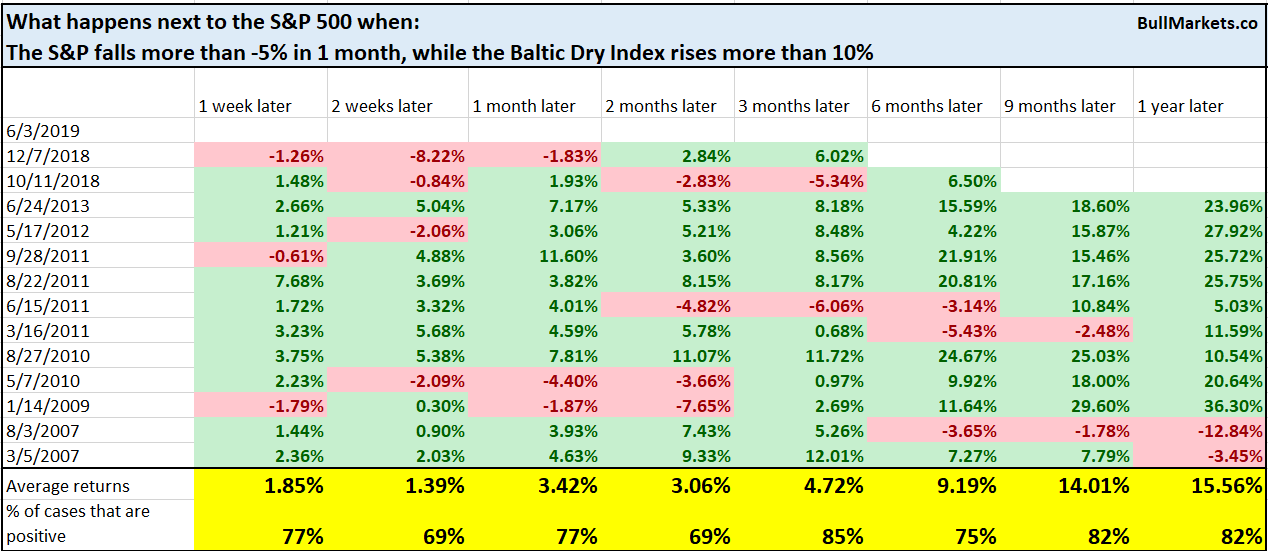
*We don’t use the Baltic Dry Index because there are plenty of better economic indicators.
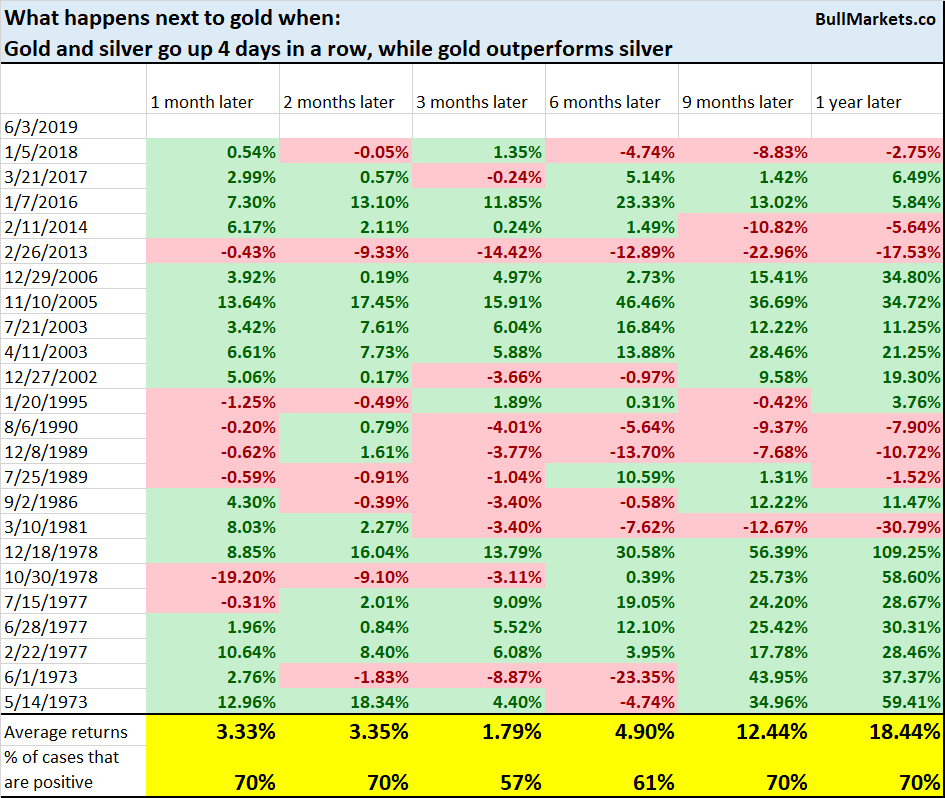
Gold And Silver
And lastly, gold and silver have both gone up 4 days in a row, while gold outperforms silver. This is a classic “safe haven” play because, during most bull markets, silver outperforms gold. (Silver is more volatile than gold, so it goes up more during a bull market).
Similar historical cases often saw some follow through on the upside over the next 1-2 months.
Conclusion
Here is our discretionary market outlook:
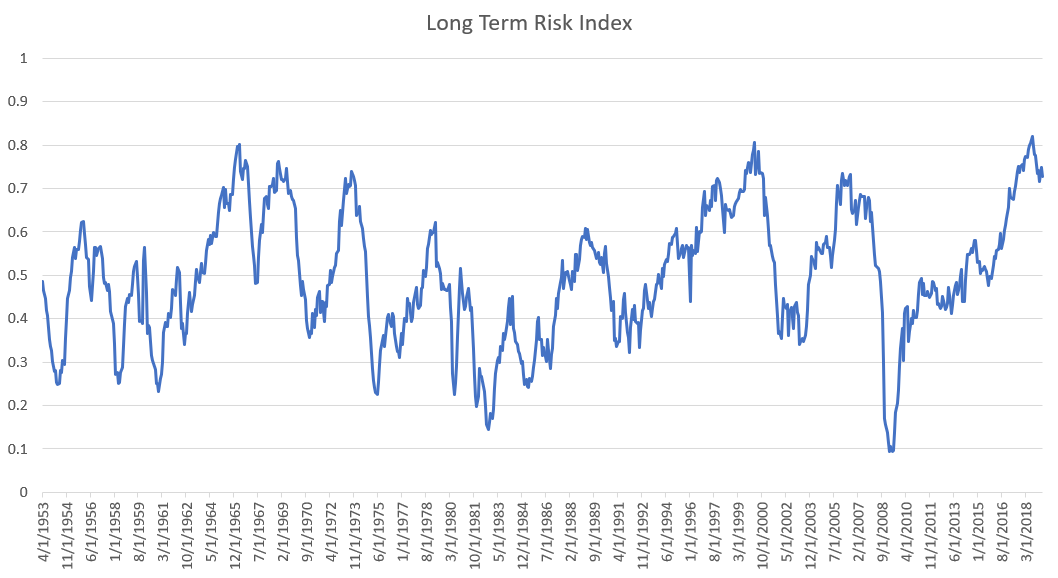
- The U.S. stock market’s long term risk: reward is not bullish. In a most optimistic scenario, the bull market probably has 1 year left.
- Most of the medium term market studies (e.g. next 6-9 months) are bullish, although a few of trend following studies are starting to become bearish.
- Market studies over the next 1-2 weeks are mixed (some bullish and some bearish). Trade war news only adds to this uncertainty.
- However, our market studies for the next 1-3 months are starting to turn more bullish.
- We focus on the medium-long term.
Goldman Sachs’ Bull/Bear Indicator demonstrates that risk: reward does favor long term bears.