By Scott DiSavino, Arathy Somasekhar and Brijesh Patel
(Reuters) - U.S. natural gas production growth is waning at the same time many countries are looking for new suppliers to help break their dependence on Russian gas after Moscow's invasion of Ukraine.
The United States is already the world's largest producer of natural gas. But the two mainstays of production - the Appalachian region and West Texas - are seeing growth slow, with companies blaming lack of adequate pipeline infrastructure, despite prices near 14-year highs.
Since Moscow invaded Ukraine on Feb. 24, U.S. gas prices have soared about 50% as European countries look to the United States, the world's second biggest exporter, to sell more liquefied natural gas (LNG) to wean Europe off Russian fuel.
Growth has slowed in Appalachia, which supplied about 37% of U.S. gas in 2021, because it has become increasingly difficult for energy firms to build new pipes to move gas out of the Pennsylvania, Ohio and West Virginia region.
With pipelines in the Permian Shale, the nation's second biggest gas supply basin, filling quickly, analysts said production growth in that Texas-New Mexico basin could slow significantly next year unless firms start building new pipelines soon. The Permian supplied about 19% of U.S. gas in 2021.
Energy analysts expect benchmark gas prices will average $4.24 per million British thermal units (mmBtu) in 2022, which would be the highest annual average in eight years.
The largest European economies import about 18.3 billion cubic feet per day (bcfd) from Russia. The United States currently can export about 9.8 bcfd as LNG. Several companies are looking to boost exports, but substantial new LNG export capacity is not expected for at least two years.
A billion cubic feet is enough gas to supply about five million U.S. homes for a day.
U.S. natural gas remains well below prices in Europe, Asia https://graphics.reuters.com/USA-NATURALGAS/PIPELINES/jnpwerllopw/chart.png
For much of the past decade, Appalachia has been the workhorse of U.S. gas production, growing by an average of 36% per year from 2010-2019.
Pipeline construction has slowed, and output growth dropped to an average of 4% in 2020 and 2021. EQT Corp (NYSE:EQT) said on its earnings call that growth will not pick up until there are more pipelines.
Appalachia "is nearing takeaway capacity limits," said analysts at Bank of America (NYSE:BAC), who estimated there would be "little to no production growth" until new pipes enter service. One giant project, the Atlantic Coast pipeline, was canceled in 2020 after costs rose from an estimated $6.0-$6.5 billion to $8 billion.
Another long-delayed project, Equitrans Midstream (NYSE:ETRN) Corp's $6.2 billion Mountain Valley line from West Virginia to Virginia, has not been completed due to ongoing lawsuits.
"This project may be the last large greenfield natural gas pipeline to go into service east of the Mississippi River for some time," said analysts at ClearView Energy Partners, who estimate Mountain Valley will enter service in mid 2023.
Growth of Appalachia pipeline export capacity stalls https://graphics.reuters.com/USA-NATURALGAS/PIPELINES/zdpxogaajvx/chart.png
The Permian Shale is the biggest U.S. oil field. That oil comes out of the ground with a lot of gas, known as associated gas.
With crude prices hovering around $100 a barrel, analysts expect energy firms to drill for more oil in the Permian with the associated gas filling existing pipes in 2023.
Permian gas output grew by an average of 17% per year from 2012-2020, before slowing to just 8% in 2021.
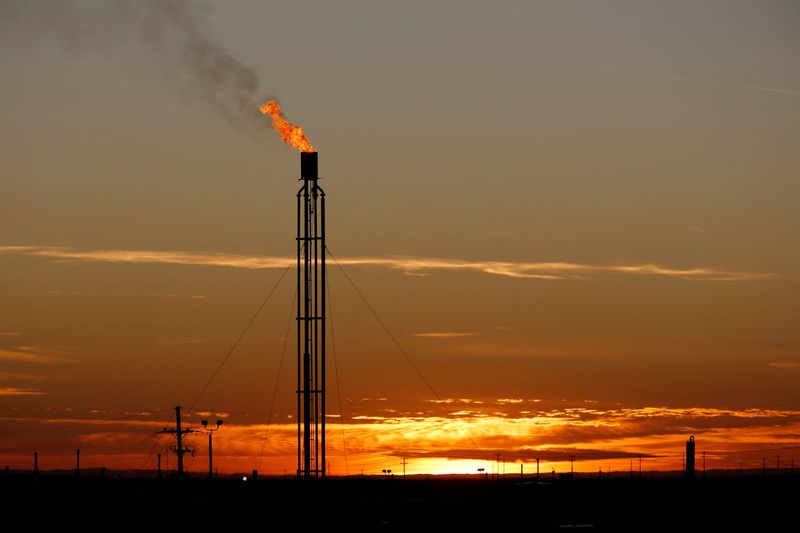
In the past, drillers would flare, or burn some of that gas. But pressure from states and investors to be more environmentally-friendly and cut greenhouse gas emissions have forced companies to reduce flaring.

Several energy companies are interested in building new pipes in the Permian, including units of Enterprise Products Partners (NYSE:EPD), Kinder Morgan (NYSE:KMI) and Energy Transfer (NYSE:ET).
Permian and Appalachia basin growth slows https://graphics.reuters.com/USA-NATURALGAS/myvmnyglwpr/chart.png