The Emini reversed up strongly over the past 2 weeks. On December 24, I said that there would probably be a rally that would be strong enough to make traders wonder if the bull trend has resumed, says Dr. Al Brooks. He's presenting at MoneyShow Orlando Feb. 8.
The rally probably will go higher, but it is still likely just a strong bull leg in what will become a trading range.
The crude oil daily chart has a weak bear rally. However, the downside is minimal because the bears are exhausted. The chart will probably be in a trading range for at least a couple months.
The 30-year bond futures chart has a parabolic wedge buy climax. There will probably be at least a couple legs sideways to down over the next 2 weeks.
Crude oil Futures market:
20 Gap Bar sell signal after weak Final Bear Flag rally
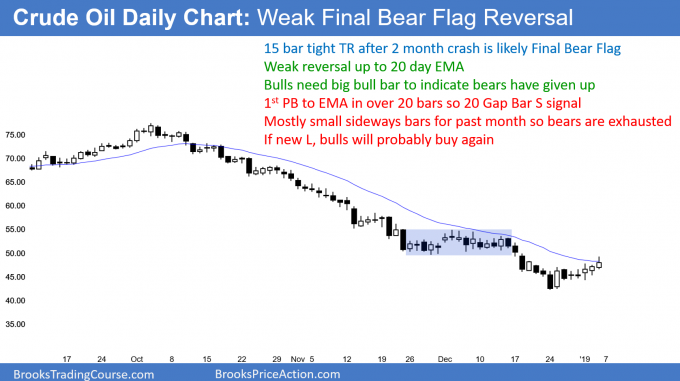
The crude oil futures daily chart is in a strong bear trend. The 2-week rally has been weak. This is the first pullback to the 20-day EMA, which means it is a 20 Gap Bar sell setup. The bulls need a big bull bar to indicate that the bears have given up. The bears are still in control, despite the possible Final Bear Flag.
The crude oil futures daily chart has a 20 Gap Bar sell setup. But, the bears want a bear bar closing near is low for a sell signal bar. Without that, the bear rally will continue.
If the bulls get a big bull bar closing near its high and far above the EMA, it would indicate that the bears have given up. It would likely lead to at least 2 legs up to around the top of the early December tight trading range. That trading range is late in a bear trend. It therefore is a good candidate for a Final Bear Flag reversal.
Minor reversal and trading range likely
Even if the bulls get their reversal, the 3 month bear channel has been tight. Consequently, the 1st reversal up will be minor. This means that it will lead to a trading range and not a bull trend.
If the 20 Gap Bar sell signal triggers, the target is a test of the low. Since the bear trend has lost momentum, there will probably be buyers below the December low. A reversal up at that point would create a wedge bottom with the November and December lows.
Despite the strong bear trend, this selloff is climactic. As a result, there is probably not much downside risk over the next couple of months. A trading range is likely to form because the bears are exhausted and less willing to sell at this low price.
US 30-year Bond futures candlestick chart:
Parabolic wedge buy climax
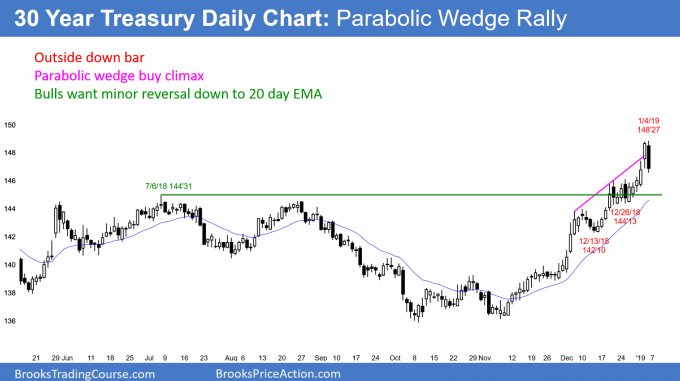
Friday was an outside down bar that closed near its low. It is a sell signal bar for a reversal down from a parabolic wedge buy climax.
The U.S. 30-year Treasury Bond future chart has rallied strongly for 2 months in a tight bull channel. Because the channel has 3 legs, it is a parabolic wedge buy climax. A trend like this is unsustainable.
The stop for the bulls is too far below. They therefore are risking more open profit than they typically do. As a result, they will take profits.
When they take profits, they will not look to buy again just 2 – 3 days later. A reasonable minimum goal is TBTL (ten bars, two legs) down to the 20-day EMA. Also, the reversal usually reaches either of the 2 higher lows. Then, the chart evolves into a trading range for the next 20 or so bars.
Outside down sell signal bar
Friday’s outside down candlestick is a sell signal bar. It represents bulls giving up. Bears will sell on a stop below its low. Their protective stop is above Friday’s high. If they get stopped out, they will sell the next reversal down as well if it comes within a few bars after the new high.
The odds are that the daily chart will trade sideways to down for at least a couple weeks. However, the tight bull channel means that the bulls are strong. Therefore, the selloff will probably be a minor reversal. This means it will lead to a trading range, not a bear trend.
Monthly S&P 500 Emini futures candlestick chart:
Bull inside bar after December sell climax
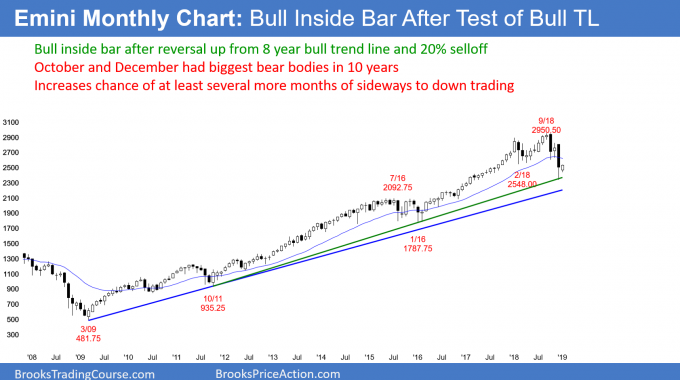
The monthly S&P 500 Emini futures candlestick chart has a small inside bar so far in January. Last month bounced from the 8-year bull trend line and a 20% correction.
The monthly S&P 500 Emini futures candlestick chart has traded in a narrow range so far in January. Last month bounced from both a 20% correction and an 8-year bull trend line. However, December had the biggest bear body in the 10-year bull trend. In addition, it closed below the 2018 trading range. Finally, it was the third bar in a big, fast correction down from the all-time high. The momentum down is strong enough to make lower prices likely.
Whenever there is a breakout, the next month is important. January is the follow-through bar. It can help predict what traders can expect over the following months.
Bear case: strong January selling, confirmed bear breakout
If the candlestick in January is a big bear trend bar closing on its low, that would signify strong follow-through selling. The bears currently have a 30% chance of this outcome. It would make lower prices likely. The Emini would probably then fall to the next support level, which is the 2,100 top of the 2014 – 2015 trading range.
That trading range is a good candidate for a Final Bull Flag. If the Emini reaches its top, it will probably continue to its bottom at around 1,800. That would be about a 40% correction.
Bull case: strong January rally, failed bear breakout
The bulls want January to form a big bull trend bar closing on its high. If they succeed, January would become a buy signal bar for February. Traders would suspect that the December bear breakout failed.
They would then look for a strong rally in February. If that were to happen, then December would likely be the end of the selloff. Traders would expect a new all-time high within a few months. There is a 20% chance of this at the moment.
Neutral case: Neutral January, need more information
Finally, if January is unclear, traders would expect more sideways trading in February. For example, if January remains inside of December’s range and the candlestick has a small body with prominent tails, traders will need more information. This is the most common situation after a breakout.
“The nail that sticks out gets hammered down”
The market is the financial king of everyone. It is strong enough to humble everyone else. If there is a prominent figure who claims to have power over the market, the market enjoys hammering that person down.
Before he was elected, Trump claimed that he had the