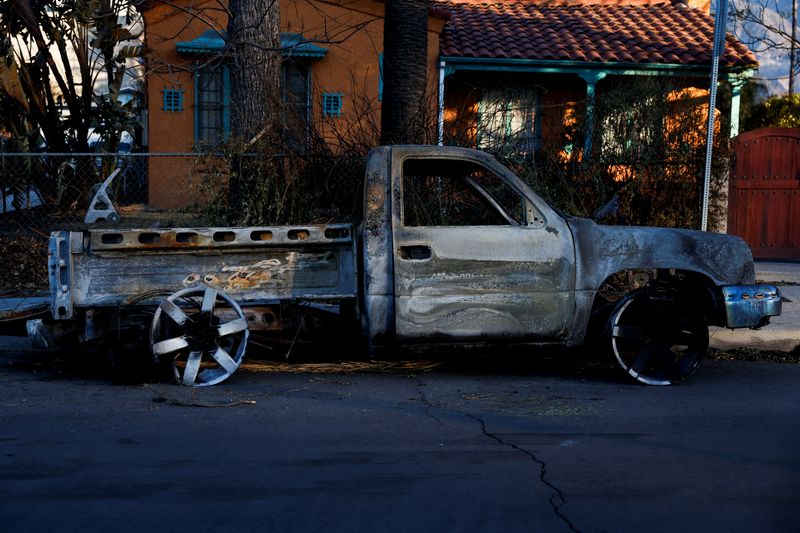
(Reuters) - The Los Angeles wildfires, which have reduced entire neighborhoods to smoldering ruins and left an apocalyptic landscape, could become the costliest wildfires in U.S. history in terms of insured losses if analysts' estimates of up to $20 billion materialize.
Dangerously high winds were expected to resume on Monday in Los Angeles, potentially hampering efforts to extinguish two stubborn wildfires that have claimed the lives of at least two dozen people.
The Los Angeles wildfire loss estimates are critical as they underscore the escalating financial risks posed by climate-related disasters, highlighting potential implications for the insurance industry and the broader economic resilience.
AccuWeather forecasts total economic losses from the disaster to range between $135 billion and $150 billion, signaling a challenging recovery and likely surging homeowners' insurance costs.
Here is an overview of the top 10 costliest wildfires ever to hit the U.S.:
Rank Name Year State Adjusted
insured losses
in 2024 dollars
1 Los Angeles 2025 California $20 billion
wildfires based on
preliminary
estimates
2 Camp Fire 2018 California $12.76 billion
3 October Fire 2017 California $11.34 billion
Siege
4 Woolsey Fire 2018 California $5.36 billion
5 Oakland 1991 California $3.98 billion
firestorm
6 August Complex 2020 California $3.64 billion
7 Fire Siege 2020 California $3.09 billion
8 Southern 2017 California $2.94 billion
California
wildfires
9 Dixie Fire 2021 California $2.88 billion
10 Glass Fire 2020 California $2.78 billion
Biggest losses globally from natural disasters:
Year Affected Event Insured Economic
country Losses losses
2005 U.S. Hurricane Katrina $105 $225 billion
billion
2022 U.S. Hurricane Ian $64 $124 billion
billion
2011 Japan Tohoku earthquake $49 $293 billion
billion
2017 U.S. Hurricane Irma $45 $77 billion
billion
2012 U.S. Hurricane Sandy $39 $96 billion
billion
2017 U.S. Hurricane Harvey $39 $115 billion
billion
2017 U.S. Hurricane Maria $38 $99 billion
billion
2021 U.S. Hurricane Ida $36 $85 billion
billion
1992 U.S. Hurricane Andrew $35 $59 billion
billion
1994 U.S. Northridge $32 $93 billion
earthquake billion

** Sources: The Swiss Re (OTC:SSREY) Institute, Reuters reports, National Centers for Environmental Information, media reports, RBC Capital Markets
** Note: Loss data has been adjusted for inflation