By Jamie McGeever
ORLANDO, Florida (Reuters) - The United States and China may be close rivals as global economic heavyweights, but they are nowhere close in the world of equity market values.
Boosted by the latest wave of the seemingly never-ending rally in the "Magnificent 7" group of leading tech giants, the U.S. share of global market cap is hitting historic highs just as China's far smaller slice shrinks further.
For all the many ways to dissect the data, they all tell a similar story: Wall Street punches well above U.S. economic weight while China's markets punch significantly below its.
This potentially creates a self-fulfilling loop where the United States continues to attract foreign capital and know-how, which underpins the dollar and, on the margins, helps keep a lid on the cost of funding.
None of that particularly benefits its archrival China.
In terms of the annual output of goods and services captured by gross domestic product data, China is a $17 trillion economy. That's some $10 trillion behind what the United States produces every year, but it's comfortably world's second largest and $13 trillion ahead of distant competitors Germany and Japan.
When measured in purchasing power parity (PPP) terms that adjusts exchange rates to better reflect currencies' domestic buying clout, China's economy is the world's largest, according to the International Monetary Fund, with a 19% share of global GDP against America's 15%.
Which makes its lack of stock market heft all the more remarkable, notwithstanding the many challenges and barriers to entry in China.
Tim Hayes, chief global investment strategist at Ned Davis Research, says there is little on the horizon to suggest the U.S.-China market divergence is about to narrow.
"There are no signs of a bubble in U.S. stocks. The risk is you get to 2000 levels of valuations and speculation, but we are not at that point yet," Hayes says, adding: "On the other hand, the market in China has become uninvestible as perceived by many people. India could catch up with China soon."
Citing data from the World Federation of Exchanges, the Securities Industry and the Financial Markets Association's latest quarterly deep dive into global equity markets shows that the value of U.S.-listed stocks rose to $49 trillion last year, or 44.9% of the world total of $109 trillion.
That's up more than 5 percentage points from a year earlier, and is the highest since the dotcom bubble peaks of more than 50% in the 2000-02 period.
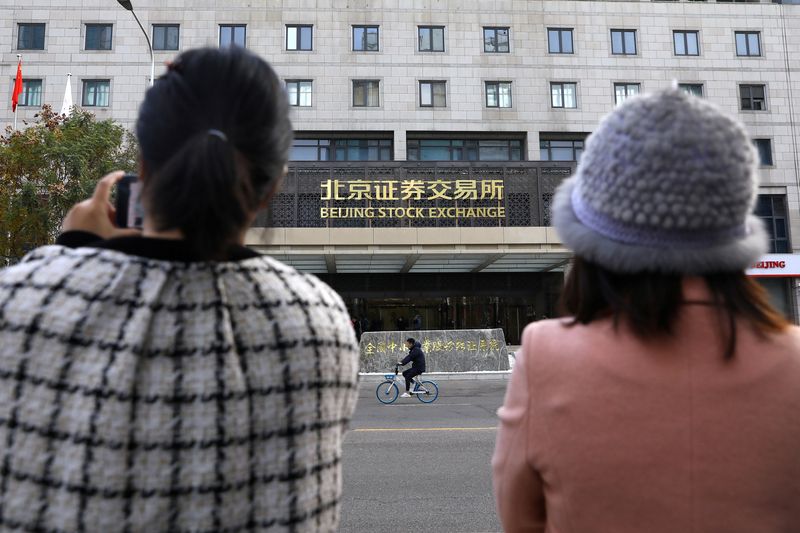
In contrast, China's share last year was just 6% - nearly half of what was a year earlier and the lowest in a decade.
CHINA IS NO 1980S JAPAN
Depending on the cut of listed companies and indices used, other measures suggest the divergence is even greater.
Hayes at NDR reckons the U.S. share of the $69 trillion MSCI All Countries World equity index now stands at a record 64%. LSEG/Refinitiv data shows that it is even higher, at 71%.
Using the LSEG/Refinitiv measure for comparison, the U.S. share is up 9 percentage points from five years ago and well up from 54% a decade ago.
China's footprint, meanwhile, is its smallest in eight years at just 2.7%. That's less than half of its record peak of 6.6% from only three years ago, and also less than half of Japan's current share of around 6%.
The comparison with Japan is instructive.
Japan is China's main regional economic and financial rival, and global capital that might previously have flowed into Chinese markets has in recent months helped drive Japanese stocks to 34-year highs.
The historical context also casts China's stock market performance in a negative light. When Japan was vying with the United States to be the world's most powerful economy in the late 1980s, Tokyo's share of global equity market cap was bigger than Wall Street's for around four years.
The gap peaked in December 1988, when Japan's share of the MSCI All Country World market cap reached an all-time high of 44%, and the U.S. share hit a record low 29%.
That was a long time ago. The United States now boasts a record gap over Japan of around 64 percentage points, but the U.S. economy is more than five times the size of Japan's.
The U.S. economy is nowhere near five times the size of China's.
But as the vanguard of the tech and artificial intelligence booms, and boasting by far the largest and most liquid markets in the world, the United States is increasingly both an unavoidable destination for big global investors and one of the few countries that can absorb outsize inflows comfortably.

"It's a tough train to stop, at least in the short term," said Chris Grisanti, chief equity strategist and regional president at MAI Capital Management.
(The opinions expressed here are those of the author, a columnist for Reuters)