By Howard Schneider
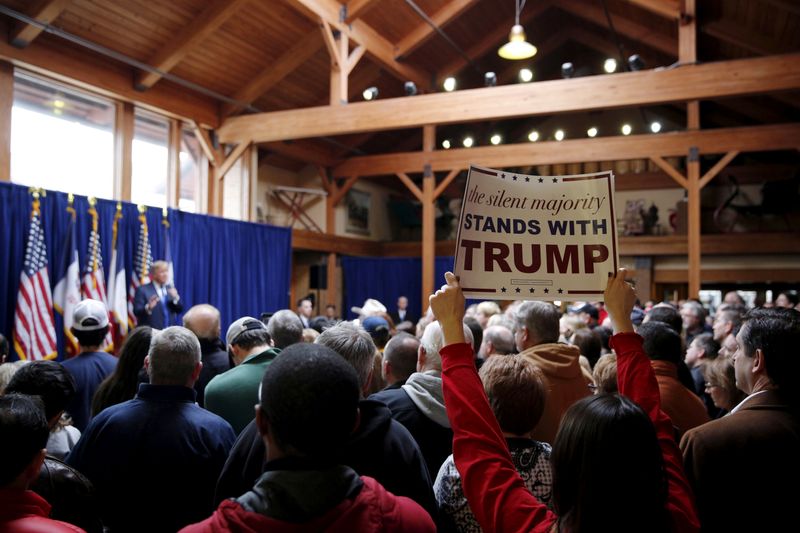
WASHINGTON (Reuters) - Nearly half the U.S. counties carried by President Donald Trump in the 2016 election were arguably in recession at the time, with local economic output shrinking during a campaign that focused on the declining fortunes of blue-collar America.
New data released by the U.S. Commerce Department's Bureau of Economic Analysis (BEA) show how a national slump in economic growth in 2016 fell most heavily on "Trump country," forming a weak economic backdrop to a bitter election campaign shaped by the Republican presidential nominee's attacks on globalization and his pledge to revive U.S. industry.
The numbers also shine a light on why, even with the economy buffeted by recent recession worries and uncertainty around the direction of global trade policy, Trump may carry built-in strengths into his re-election campaign next year: the bounceback from that 2016 slump has been strong and widespread, at least through 2018, according to the data released last week.
In issuing its first official estimate of gross domestic product by county, the BEA provided a granular look at how economic conditions are evolving in one of the country's basic geographic units.
In this case, it sheds light on why the 2016 election reflected so much economic anxiety even though unemployment had dipped below the 5% mark and median incomes had begun notching strong gains.
A possible answer: In much of the country, where Trump's appeal proved strongest, the economy was actually backpedaling.
For the U.S. economy as a whole, 2016 was an off year. Economic growth slowed to a tepid 1.6% annual rate, which was a five-year low and a sharp drop from the 2.9% pace of 2015.
The pain, however, was not equally spread. A global crash in oil prices had hit the country's energy producers hard, and led to declines in business investment and manufacturing felt most acutely where Trump's populist message was gaining traction.
Across the roughly 2,600 counties that he won in the election, growth barely breached 1% in 2016, low even by the standards of the sluggish recovery from the 2007-2009 recession. In some 1,200 of those counties, GDP actually fell by close to 4% in 2016.
By contrast, the overall growth rate of the roughly 500 counties carried by Democratic presidential nominee Hillary Clinton was 1.8%, faster than the nation as a whole. Only about a third of the counties she won saw a decline in economic activity, and for those it was a shallow dip.
The data re-enforce some common themes - of the growing economic clout of the largest cities, for example, and of the shrinking economic share of the economy accounted for by small towns and rural communities.
Clinton, for example, won the U.S. popular vote with support that was geographically concentrated in larger urban areas. Those places are the most economically productive, accounting for about two-thirds of national output as it stands, and steadily gaining more.
From 2010 to 2018, the 30 counties with the largest economies expanded their share of the nation's total output to 31.7% from 29.5% - a jump worth more than $90 billion. Only two of those places voted for Trump: Tarrant County, Texas, which includes Fort Worth, and Maricopa County, Arizona, which includes Phoenix.
It also shows how recent economic developments hold both promise and risk for Trump's re-election chances.
STEADY IMPROVEMENT
The past year has seen business investment plans and overall economic growth disrupted by Trump's trade wars with China and other countries - and the impact likely fell most heavily among the agricultural and manufacturing areas the president will need to win to remain in the White House.
County GDP data for 2019 won't be available until late next year, but the slowing growth of the past year "is again going to impact those segments more than others," said Gregory Daco, chief U.S. economist with Oxford Economics.
Oxford's election-year model, based on inflation, unemployment and other economic forecasts, predicted in October that Trump would win 55% of the popular vote next year. Federal Reserve policymakers' latest median forecast is for GDP growth of 2% in 2020.
Even if recent developments weighed on the economy in counties supportive of Trump, the first two years of his presidency saw many of them regain lost momentum.
The number of counties with negative GDP growth has fallen by nearly half over that time.
The counties won by Clinton have grown faster overall, and as a whole reached Trump's 3% GDP growth target in 2018. The counties that voted for Trump in 2016, by contrast, grew by around 2.7% last year.
Still, the economic improvement in counties won by Trump has been steady and touched parts of the swing states of Ohio and Wisconsin that were won by former President Barack Obama in 2012 but voted for Trump four years later. Both those states were in Trump's column in 2016.
The key, Daco said, is whether recent events like the preliminary resolution of Washington's trade spat with China is felt quickly at the local level.

"Look nine months down the road," he said. "Is it an environment in which those counties are again suffering the most?"