By Enrico Dela Cruz
MANILA (Reuters) - Economic growth in developing Asia this year will be slightly lower than previously expected as the weakness in China's property sector and El Niño-related risks cloud regional prospects, the Asian Development Bank (ADB) said on Wednesday.
Updating its regional economic outlook, the ADB trimmed its 2023 growth forecast for developing Asia to 4.7%, from 4.8% projected in July.
But the growth forecast for next year for the grouping, which consists of 46 economies in the Asia-Pacific and excludes Japan, Australia and New Zealand, was revised slightly upwards to 4.8% from 4.7% previously.
"We see resilient growth in the region really based on pretty strong domestic consumption and investment, and despite reduced external demand, which is a dampener on export-driven growth," Albert Park, ADB's chief economist, told a press conference.
The ADB tempered its growth forecasts for East Asia, South Asia, and Southeast Asia this year, with China and India expected to grow 4.9% and 6.3%, respectively, slightly lower than the July growth projections of 5.0% and 6.4%.
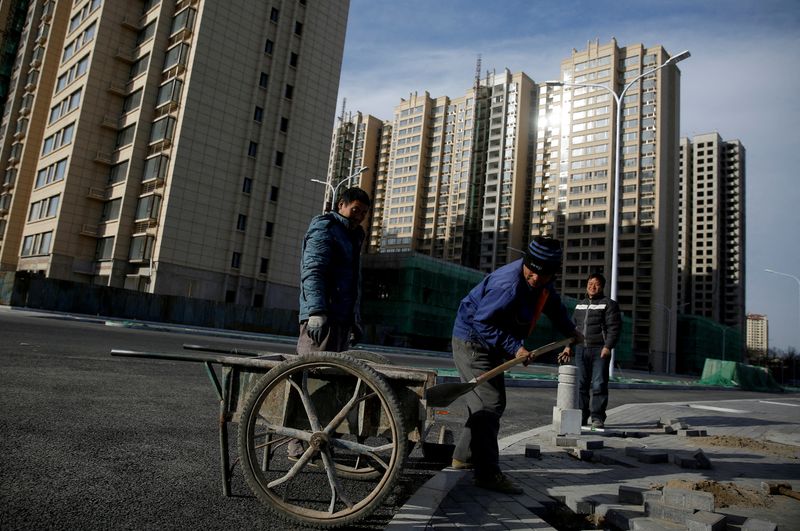
China's property crisis "poses a downside risk and could hold back regional growth," the ADB said in its report.
The Manila-based lender maintained its 2024 growth forecasts for China and India at 4.5% and 6.7% respectively.
While growth has so far been robust and inflation pressures are receding in developing Asia, Park said governments need to be vigilant against the many challenges the region faces, including food security.
Inflation in developing Asia is forecast to ease to 3.6% this year from 4.4% last year, and continue to slow to 3.5% in 2024, giving central banks policy space, but the ADB said interest rate hiking and easing cycles will vary going forward.
GDP GROWTH 2021 2022 2023 2023 2023 2024 2024 2024
APR JULY SEPT APR JULY SEPT
Caucasus and 5.8 5.1 4.4 4.3 4.6 4.6 4.4 4.7
Central Asia
East Asia 7.9 2.8 4.6 4.6 4.4 4.2 4.2 4.2
China 8.4 3.0 5.0 5.0 4.9 4.5 4.5 4.5
South Asia 8.4 6.7 5.5 5.5 5.4 6.1 6.1 6.0
India 9.1 7.2 6.4 6.4 6.3 6.7 6.7 6.7
Southeast Asia 3.5 5.6 4.7 4.6 4.6 5.0 4.9 4.8
Indonesia 3.7 5.3 4.8 4.8 5.0 5.0 5.0 5.0
Malaysia 3.1 8.7 4.7 4.7 4.5 4.9 4.9 4.9
Myanmar -5.9 2.0 2.8 n/a 2.8 3.2 n/a 3.2
Philippines 5.7 7.6 6.0 6.0 5.7 6.2 6.2 6.2
Singapore 8.9 3.6 2.0 1.5 1.0 3.0 3.0 2.5
Thailand 1.5 2.6 3.3 3.5 3.5 3.7 3.7 3.7
Vietnam 2.6 8.0 6.5 5.8 5.8 6.8 6.2 6.0
The Pacific -1.4 6.1 3.3 3.3 3.5 2.8 2.8 2.9
Developing Asia 7.2 4.3 4.8 4.8 4.7 4.8 4.7 4.8
INFLATION
APR JULY SEPT APR JULY SEPT
Caucasus and 9.0 12.9 10.3 10.6 10.6 7.5 7.8 8.0
Central Asia
East Asia 1.1 2.3 2.3 1.3 1.0 2.0 2.1 2.1
China 0.9 2.0 2.2 1.0 0.7 2.0 2.0 2.0
South Asia 5.8 8.2 8.1 8.1 8.6 5.8 6.4 6.6
India 5.5 6.7 5.0 4.9 5.5 4.5 4.5 4.2
Southeast Asia 2.0 5.1 4.4 4.3 4.2 3.3 3.2 3.3
Indonesia 1.6 4.2 4.2 3.8 3.6 3.0 3.0 3.0
Malaysia 2.5 3.4 3.1 3.1 3.0 2.8 2.8 2.7
Myanmar 3.6 18.4 10.5 n/a 14.0 8.2 n/a 8.2
Philippines 3.9 5.8 6.2 6.2 6.2 4.0 4.0 4.0
Singapore 2.3 6.1 5.0 5.0 5.0 2.0 2.0 3.0
Thailand 1.2 6.1 2.9 2.9 2.5 2.3 2.3 2.3
Vietnam 1.8 3.2 4.5 4.0 3.8 4.2 4.0 4.0

The Pacific 3.1 5.2 5.0 5.0 4.9 4.4 4.4 4.5
Developing Asia 2.6 4.4 4.2 3.6 3.6 3.3 3.4 3.5