By Barani Krishnan
Investing.com - "All that shines" just got a little shinier.
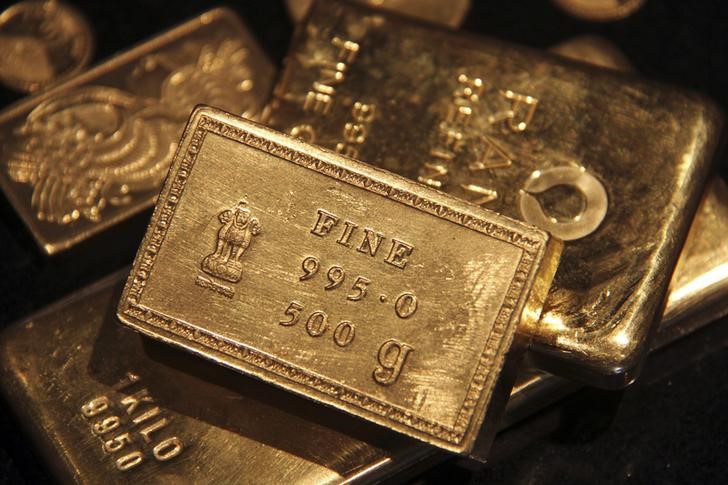
Bullion and futures of gold jumped nearly 1% on Thursday, their biggest spring in nearly two weeks, as risk-averse investors fleeing everything from equities to oil embraced the safe-haven sanctuary of the yellow metal.
Spot gold, reflective of trades in bullion, traded at $1,285.22 per ounce by 2:38 PM ET (18:38 GMT), up $11.81, or 0.9%, on the day.
Gold futures for June delivery, traded on the Comex division of the New York Mercantile Exchange, settled up $11.20, or 0.9%, at $1,285.40 per ounce.
It was the largest percentage gain in a day for gold since May 15 and came despite a near-1% gain in the rival U.S. dollar earlier in the day. The U.S. dollar index, which measures the greenback against a basket of six currencies, reached a near-one-week high of 98.37 before falling back to 97.84, off 0.2%, at 3:00 PM ET (17:00 GMT).
Just earlier this week, gold hit a two-week low under $1,275 an ounce. Now, analysts said it might not have trouble recapturing the psychologically important bullish perch of $1,300.
"Gold is not only a haven in these turbulent times, but looking forward to inflation, the sleeping giant, awakening," said George Gero, precious metals analyst at RBC Wealth Management in New York.
Global macro assets have been under pressure since the week began after U.S. President Donald Trump moved to block popular Chinese cellphone maker and technology giant Huawei from the U.S. market as an extension of the tariffs he had been piling on China. The White House upped the ante against Beijing on Thursday, reportedly considering Huawei-like sanctions on Chinese video surveillance firm Hikvision over the country’s treatment of its Uighur Muslim minority.
Wall Street's three key stock indexes fell by more than 1% each as investors fled from risk on fears that the U.S.-Sino trade war will have profound and long-term consequences for growth.
On energy markets, crude oil prices plunged 5% in this year's worst crash and the worst drop since the start of OPEC production cuts in December. The escalating trade war and huge crude pileups from weak refiner demand combined to roil the market.
The United States 10-Year Treasury note fell to its lowest level since November 2017, down nearly 4% on the week, a sign of panic over the trade war.
Elsewhere in metals, palladium fell but managed to hold on to its mantle as the world's costliest traded metal.
Spot palladium was down $7.86, or 0.6%, at $1,310.14 an ounce. The silvery-white metal, used for purifying gasoline emissions, traded above $1,600 at one point in early March. But it has lost about 20% since on concerns that it may have rallied too fast, too soon on talk of tight supply.
Trades in other Comex metals as of 3:30 PM ET (19:30 GMT):
Palladium futures down $9.20, or 0.7%, at $1,304.30 per ounce.
Platinum futures down $5.20, or 0.7%, at $800.10 per ounce.
Silver futures up 15 cents, or 1%, at $14.60 per ounce.
Copper futures flat at $2.68 per pound.
