🤑 It doesn’t get more affordable. Grab this 60% OFF Black Friday offer before it disappears…CLAIM SALE

Chart Of The Week: Corporate Bonds Go Vertical

Published 04/06/2016, 01:38 AM
Updated 05/14/2017, 06:45 AM
BARC
-
SPLB
-

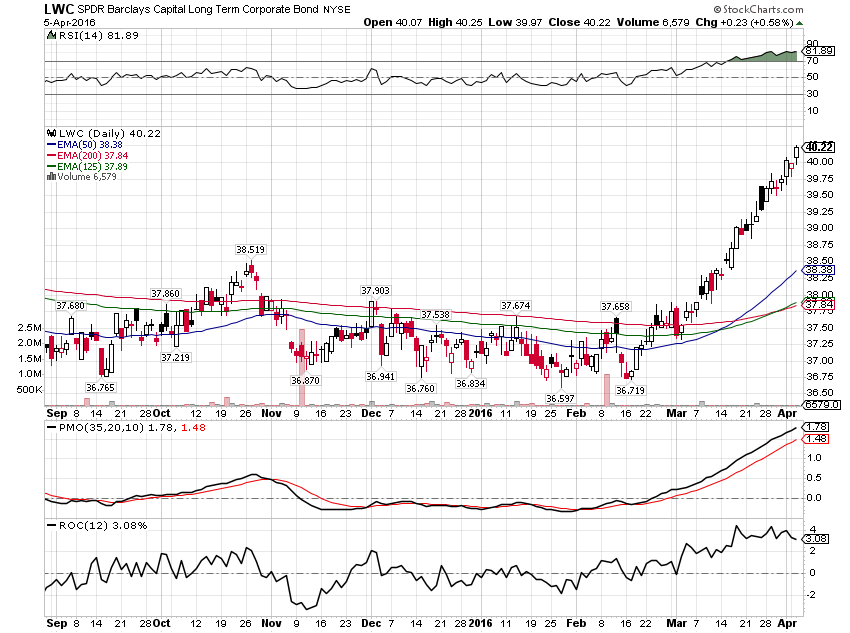
You don’t often see a move like this in a bond market. This long term, high grade corporate bond ETF from SPDR, is up 6.6% in the last month.
LWC Daily Chart

I chose this chart because of what it shows about modern markets, which don’t allow for much introspection on the part of investors. We’re all traders now and when the momentum hits an asset you better get on or you’ll miss the ride entirely. I don’t know of any massive change in fundamentals for long term (13 year duration), investment grade (90% A and BBB) bonds over the last month that would account for a 6.5% move.

So, what makes something normally sedate like this move that much? There doesn’t appear to be any significant short interest in SPDR Barclays (LON:BARC) Long Term Corporate Bond (NYSE:LWC) itself but maybe there were shorts in the underlying bonds that needed covering. Or maybe it is a function of bond market liquidity which is a problem for buyers and sellers. This was across the board in investment grade corporate bond ETFs so it isn’t anything specific to LWC.

Whatever the cause, I think one ought to tread carefully here. Vertical moves like this is are generally unstable and subject to quick reversals.

Latest comments

Loading next article…
Risk Disclosure: Trading in financial instruments and/or cryptocurrencies involves high risks including the risk of losing some, or all, of your investment amount, and may not be suitable for all investors. Prices of cryptocurrencies are extremely volatile and may be affected by external factors such as financial, regulatory or political events. Trading on margin increases the financial risks.
Before deciding to trade in financial instrument or cryptocurrencies you should be fully informed of the risks and costs associated with trading the financial markets, carefully consider your investment objectives, level of experience, and risk appetite, and seek professional advice where needed.
Fusion Media would like to remind you that the data contained in this website is not necessarily real-time nor accurate. The data and prices on the website are not necessarily provided by any market or exchange, but may be provided by market makers, and so prices may not be accurate and may differ from the actual price at any given market, meaning prices are indicative and not appropriate for trading purposes. Fusion Media and any provider of the data contained in this website will not accept liability for any loss or damage as a result of your trading, or your reliance on the information contained within this website.
It is prohibited to use, store, reproduce, display, modify, transmit or distribute the data contained in this website without the explicit prior written permission of Fusion Media and/or the data provider. All intellectual property rights are reserved by the providers and/or the exchange providing the data contained in this website.
Fusion Media may be compensated by the advertisers that appear on the website, based on your interaction with the advertisements or advertisers.
© 2007-2024 - Fusion Media Limited. All Rights Reserved.