Our normal policy is to produce articles and analysis on companies that we believe offer attractive valuations based on earnings and cash flows. However, we’ve recently received numerous requests to write about companies that may be overvalued by Mr. Market. This article is going to cover a company that we have owned in the past, and very much admire for its long consistent record of operating excellence as reflected by its consistent record of earnings and dividend growth. This superb business is Fastenal Company (FAST), and we believe it is an extraordinary business that the market is currently overpricing.
Fastenal (FAST) is a leading retailer and wholesaler of industrial and construction supplies. The company operates approximately 2500 stores located in the United States, Puerto Rico, Canada, Mexico, Singapore, China, the Netherlands, United Kingdom, Hungary and Malaysia. The company’s primary product lines range from fasteners, tools, hydraulics and pneumatics, to janitorial supplies, batteries, sealants and much more.
Fastenal Company: A Legacy of Operating Excellence
Fastenal Company (FAST) has a long history of increasing their earnings at a high and consistent rate. The following earnings and price correlated F.A.S.T. Graphs™ reviews their operating history from calendar year 1994 to the end year 2008. Our purpose for stopping the graph at calendar year 2008 was to illustrate three important facts. First, we wanted to show how they have increased earnings per year at a compounded rate of almost 24% per annum up to the great recession of 2008. Second, we wanted to graphically illustrate how the long-term trend line movement of the stock price has closely correlated to and tracked earnings growth. Finally, we wanted to illustrate how the market has often priced their shares at a premium to earnings growth.
Therefore, to summarize the following graphic: From 1994 to 2008 the Fastenal Company grew earnings from $.6 a share in 1994 to $.95 a share by 2008, resulting in a 23.7% compound annual growth rate. The normal PE line depicts a trimmed (the highest PE and the lowest PE trimmed) average PE ratio of 36.3, this simply indicates that the market has often priced this company at a peg ratio in excess of one. On the other hand, it is clear from the picture that the stock price often moved above and below the normal PE, and in many cases traded at its orange earnings justified valuation line.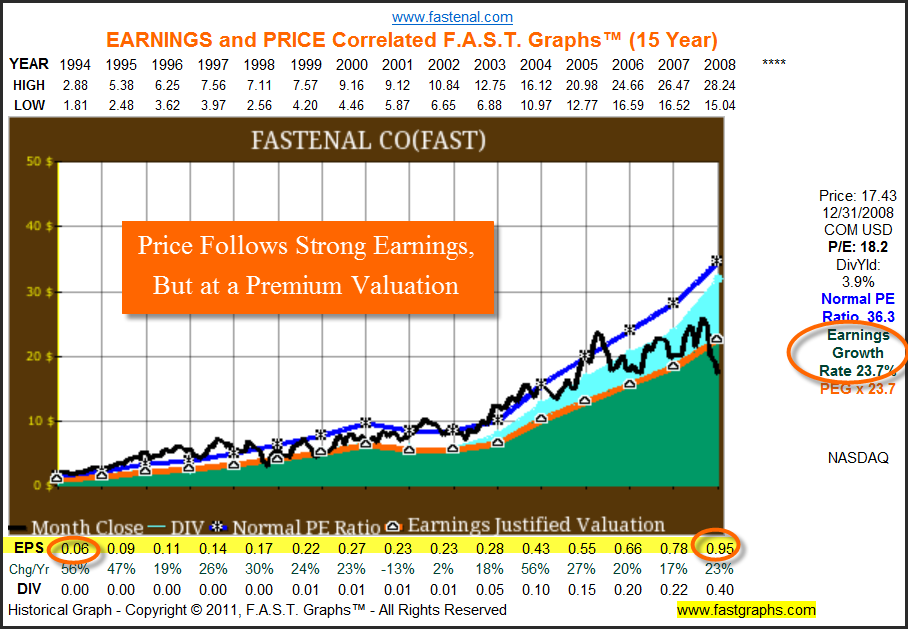
Our next earnings and price correlated graph covers the 15-year period 1998 to current time.There are a couple of important points that should be emphasized here.Notice how the 35% drop in earnings for calendar year 2009 impacted Fastenal Company’s compounded earnings growth rate. This one-year drop in earnings reduced its average annual growth rate from 23.7% to 17.4%. However, also notice how earnings growth since calendar year 2009 has actually exceeded the long-term average of 23.7%, averaging 33.9%. Also, notice that the normal PE ratio now calculates to 32.4 instead of 36.3. It’s important that the reader understands that these measurements simply represent barometers rather than absolute values.
To reiterate, since calendar year 2010, Fastenal Company has grown earnings at the average rate of 33.9% per annum. This accelerated earnings growth should be considered as coming off of the low base which was created by the recession of 2008.Furthermore, we believe this accelerated earnings growth greatly attributes to the company’s current abnormally high PE ratio of 37.8. In other words, the market is valuing this company very optimistically. 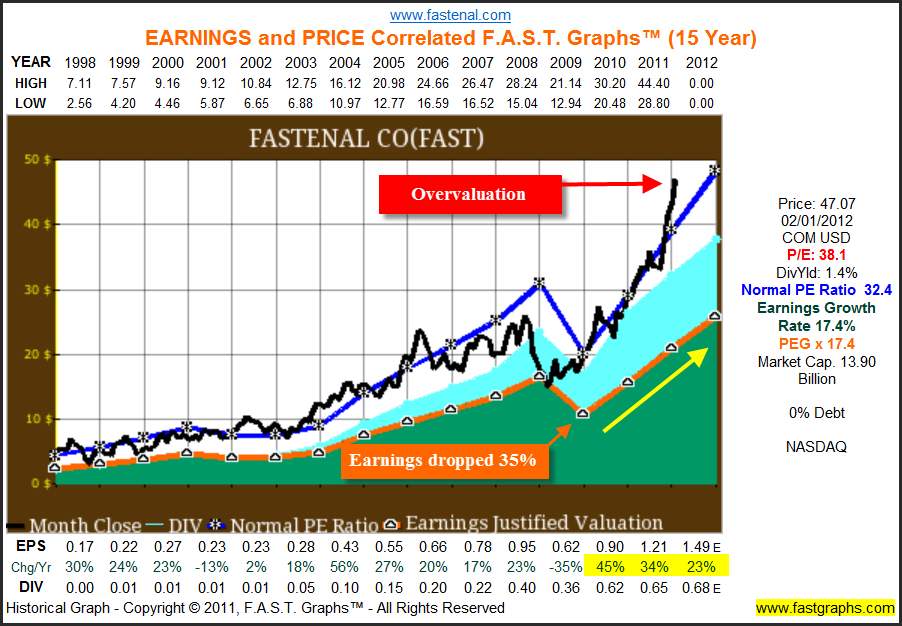
When you review the performance associated with the above earnings and price correlating graph we discover an almost perfect correlation between Fastenal’s earnings growth rate of 17.4% and the capital appreciation it generated for shareholders of 17.6%. Also, notice that the company is a Dividend Contender that has increased its dividend every year for 13 consecutive years (note that the dividend cut reflected in the table for 2009 is due to a special one-time extra dividend that was paid in 2008).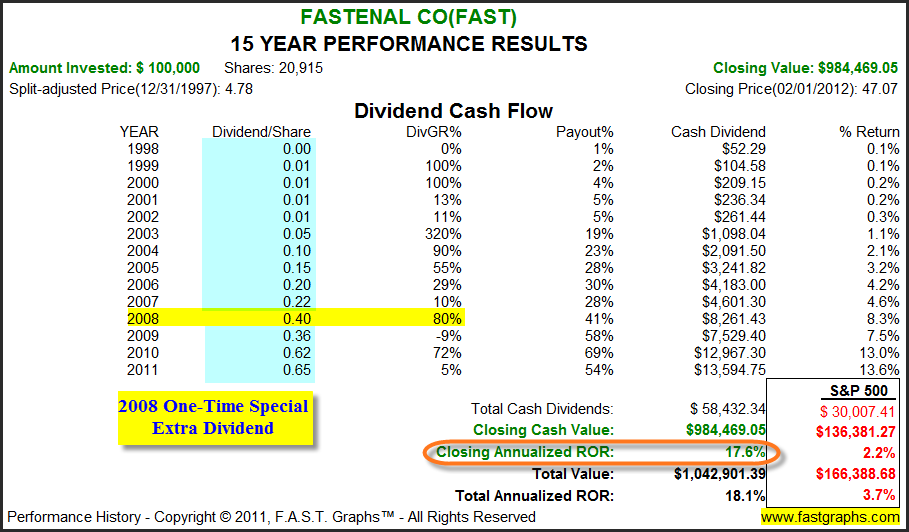
Fastenal Company - A Clear Picture of Overvaluation
The following estimated earnings and return calculator is drawn based on the consensus of 10 analysts reporting to Capital IQ. The consensus of these leading analysts forecast earnings growth over the next five years at 19%. The Value Line Investment Survey forecasts approximately 15.5% earnings growth, and the consensus of nine analysts reporting to Zacks expect five-year earnings growth of 18.1% . The point is that all of these various estimates are more or less in alignment, with only modest and reasonable deviations from each other. Therefore, we’re comfortable in stating that a 15% to 20% growth rate on this extremely high-quality company with its great track record seems reasonable, all things considered.
Therefore, assuming that the estimates from the various analysts are within reason correct, then we would argue that this high-quality company, with no debt on its balance sheet, and a great record of earnings growth, is nevertheless very expensive today. We believe this is also apparent in the context of the fact that there are numerous other companies with similar operating histories, and dividend yields that are trading at PE ratios one-half to one-third of what is currently being awarded to Fastenal Company.
We beieve that we would all agree that if you took one dollar’s worth of Fastenal’s dividend to a store to buy something, and one dollar’s worth of dividends from another company with a similar growth rate, the store proprietor would not give you more change on Fastenal’s dollar than they would the other company’s. In other words, one dollar’s worth of earnings of one company is worth no more or no less than one dollar’s worth of earnings of another.
Since this is true, how do you explain the fact that the market will value Fastenal’s one dollar’s worth of earnings today at $38, and for example, only value a dollar’s worth of earnings from the luxury retailer Coach (COH) at only $21 a share. This is especially befuddling when you consider that Coach’s historical earnings growth rate of 33% per annum is almost twice as high as Fastenal Company’s.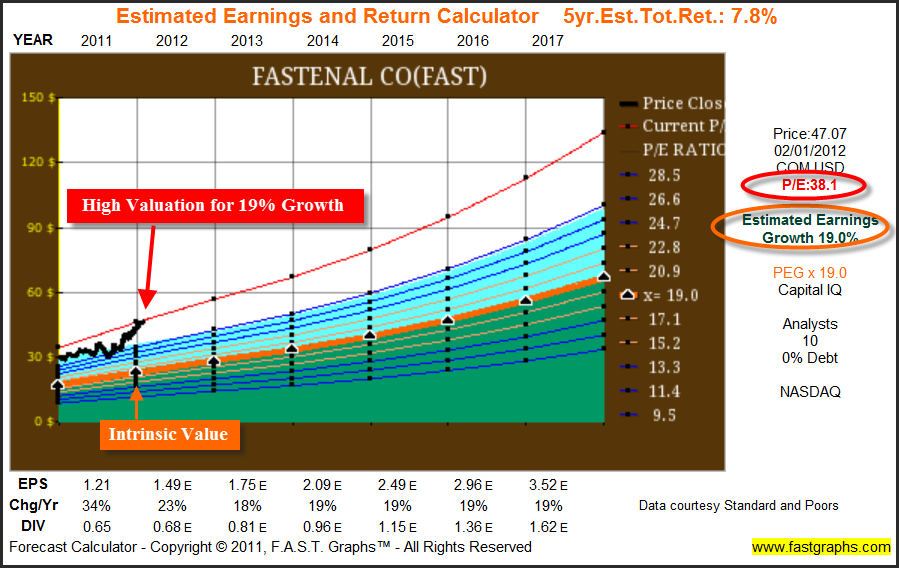
To put a final perspective on why we believe that Fastenal is overvalued, is to calculate the earnings yield that the current valuation reflects. The following earnings yield estimator shows that at today’s valuation, Fastenal only offers prospective investors an earnings yield of 3.2%. Additionally, the dividend yield of 1.5% is less than what can be earned on the riskless 10-year Treasury bond. This seems like an awful low return from earnings and dividends for the amount of risk that the prospective investor is being asked to assume.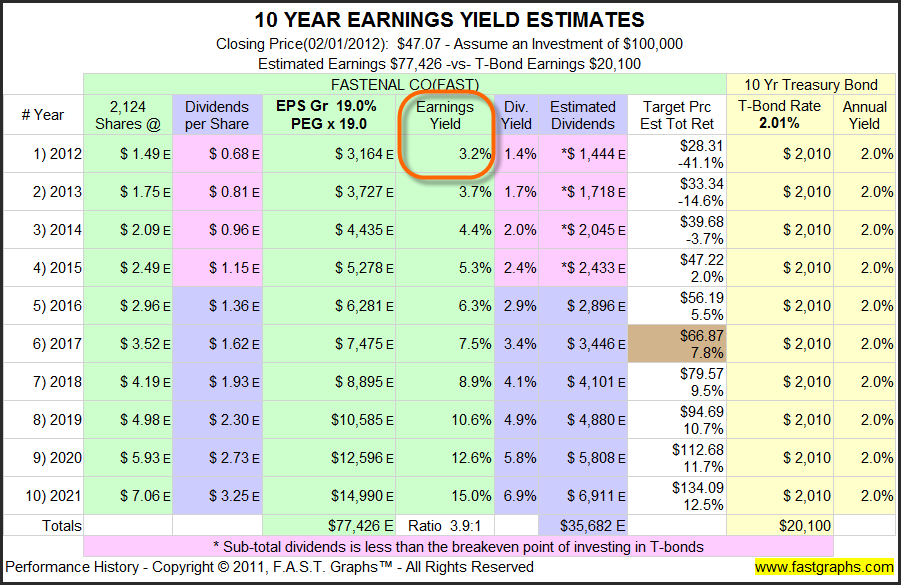
Conclusion
We believe that the Fastenal Company is an extremely high-quality stock with a very bright future. Nevertheless, we feel that the current valuation the market is placing on their shares is not only higher than their fundamentals justify, but also seem excessive in light of the valuations that the market is generally applying to other businesses. Consequently, we believe that shareholders would be prudent to either sell their shares or at least take some of their profits off the table. The stock has had a great run over the last three years but valuation now appears to be excessive. The great investor Warren Buffett once advised us that “price is what you pay, but value is what you get.”
Disclosure: No positions at the time of writing.
Disclaimer: The opinions in this document are for informational and educational purposes only and should not be construed as a recommendation to buy or sell the stocks mentioned or to solicit transactions or clients. Past performance of the companies discussed may not continue and the companies may not achieve the earnings growth as predicted. The information in this document is believed to be accurate, but under no circumstances should a person act upon the information contained within. We do not recommend that anyone act upon any investment information without first consulting an investment advisor as to the suitability of such investments for his specific situation.
- English (UK)
- English (India)
- English (Canada)
- English (Australia)
- English (South Africa)
- English (Philippines)
- English (Nigeria)
- Deutsch
- Español (España)
- Español (México)
- Français
- Italiano
- Nederlands
- Português (Portugal)
- Polski
- Português (Brasil)
- Русский
- Türkçe
- العربية
- Ελληνικά
- Svenska
- Suomi
- עברית
- 日本語
- 한국어
- 简体中文
- 繁體中文
- Bahasa Indonesia
- Bahasa Melayu
- ไทย
- Tiếng Việt
- हिंदी
Fastenal (FAST): A Vivid Case of Overvaluation
Published 02/02/2012, 11:52 PM
Updated 07/09/2023, 06:31 AM
Fastenal (FAST): A Vivid Case of Overvaluation
Latest comments
Loading next article…
Install Our App
Risk Disclosure: Trading in financial instruments and/or cryptocurrencies involves high risks including the risk of losing some, or all, of your investment amount, and may not be suitable for all investors. Prices of cryptocurrencies are extremely volatile and may be affected by external factors such as financial, regulatory or political events. Trading on margin increases the financial risks.
Before deciding to trade in financial instrument or cryptocurrencies you should be fully informed of the risks and costs associated with trading the financial markets, carefully consider your investment objectives, level of experience, and risk appetite, and seek professional advice where needed.
Fusion Media would like to remind you that the data contained in this website is not necessarily real-time nor accurate. The data and prices on the website are not necessarily provided by any market or exchange, but may be provided by market makers, and so prices may not be accurate and may differ from the actual price at any given market, meaning prices are indicative and not appropriate for trading purposes. Fusion Media and any provider of the data contained in this website will not accept liability for any loss or damage as a result of your trading, or your reliance on the information contained within this website.
It is prohibited to use, store, reproduce, display, modify, transmit or distribute the data contained in this website without the explicit prior written permission of Fusion Media and/or the data provider. All intellectual property rights are reserved by the providers and/or the exchange providing the data contained in this website.
Fusion Media may be compensated by the advertisers that appear on the website, based on your interaction with the advertisements or advertisers.
© 2007-2024 - Fusion Media Limited. All Rights Reserved.
