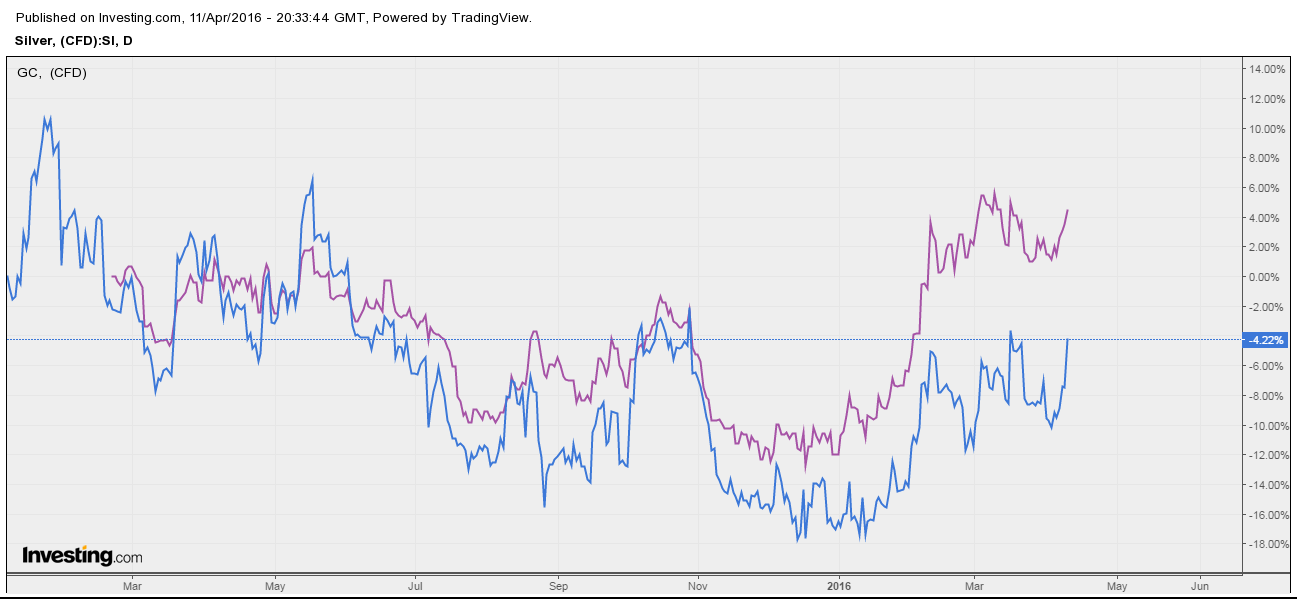
Primary bearish trend on silver and gold seems to be over with the start of 2016. Both commodities started a bullish trend, though silver is reacting worse than gold (about -4% daily).
SILVER:GOLD
Silver = blue price line
Gold = purple price line
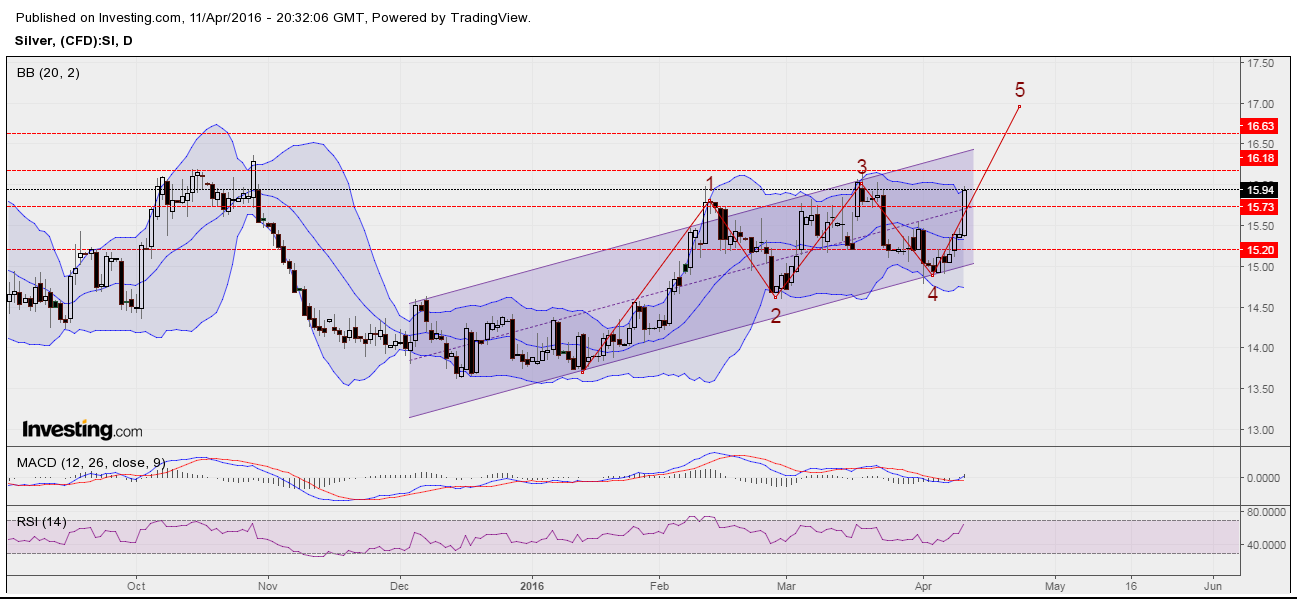
SILVER DAILY CHART
Silver started to generate an Elliott impulse wave on secondary trend, which should end on point (5) at 16.95 (0.618 Fibonacci extension). Buy signal is given from MACD, but RSI is approaching on the overbought zone, so it should last only on short-term period.
Main supports: 15.73, 15.20.
Next resistance: 16.18, 16.63.
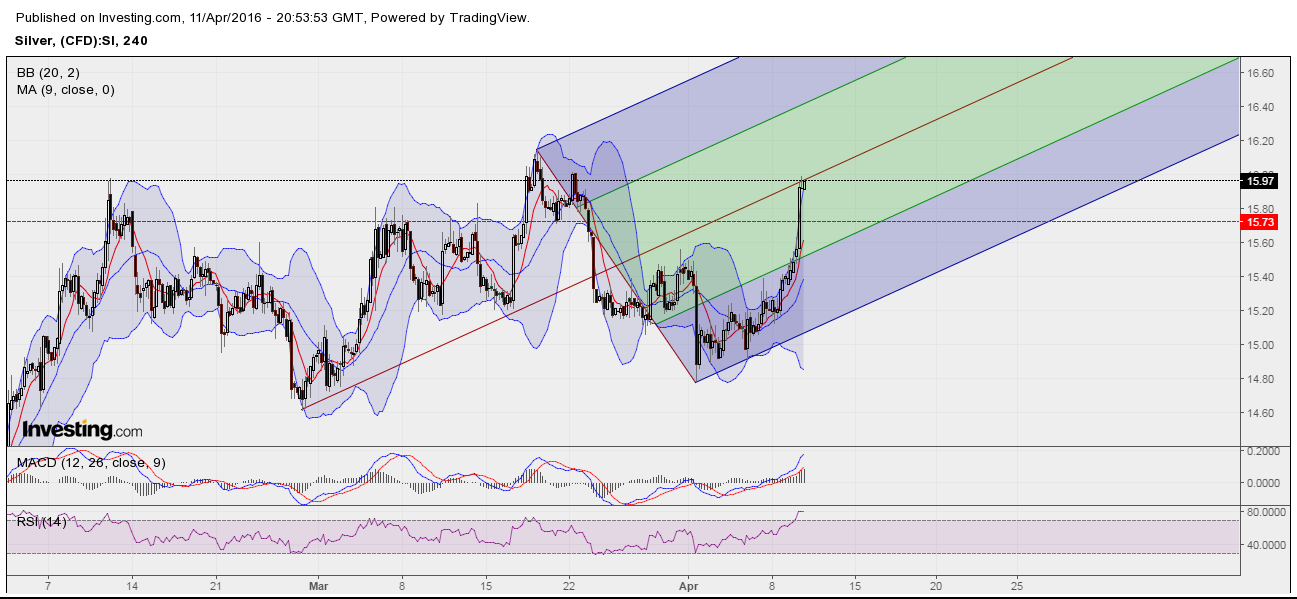
SILVER 4H TIME FRAME
On the 4-hour time frame, price trend reached maximum extension on pitchfork median at 15.79 (0.764 Fibonacci) even though both MACD and RSI are giving sell signals. From now this should retrace almost to 15.55 (0.236 Fibonacci retracement), unless 15.73 support holds prices.
My advice is to wait for a retracement to 15.70 in order to open short-term long positions. Reverse could happen before $17, so be ready to sell in the next few days.


