Telstra Corporation Ltd. (AX:TLS) - Chart Review
NB: The charts presented are prepared using data at the close of Friday 25th November.
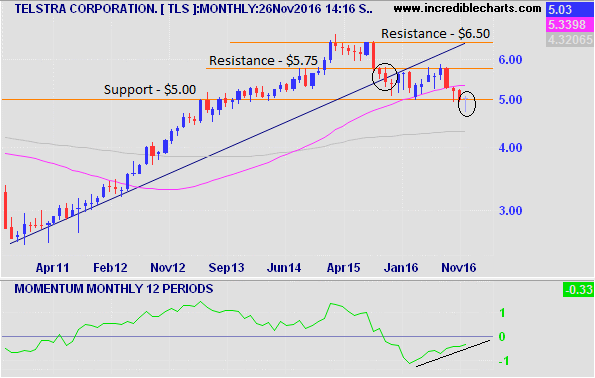
Telstra has been struggling to move higher in price since breaking its long term uptrend back in October last year. ( See circle over blue trend line below) However in November it has made a strong recovery after being as low as $4.70 early in the month, to close at $5.03 last Friday.
Must Stay Above Support At $5.00
On the monthly chart below Telstra is showing signs of a reversal as the current price is slightly up for the month, with a long tail pointing down representing buying pressure. In addition the price recovered to be above the critical support level of $5.00. With 3 trading days left in November it's critical that Telstra can close on the monthly chart above $5.00, in order to give it a chance to move higher in December.
Lastly on the Monthly chart , momentum has also made a strong recovery over the last few months as it moves closer to being positive. Currently it stands at -0.33, however its moving in the right direction to confirm the support of $5.00 price level.
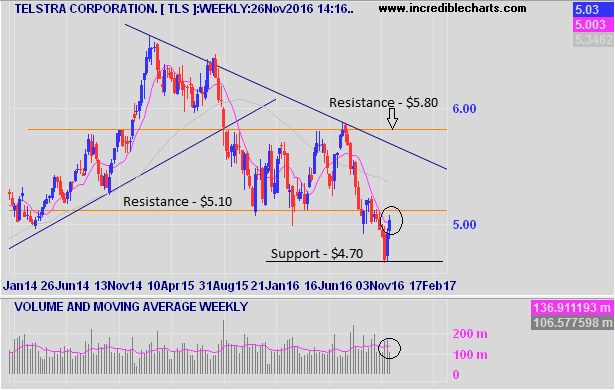
On the weekly chart below it's not looking as bullish for a reversal just yet, as there are few things still required to confirm a reversal.
The positives:
*The current price on the weekly chart of $5.03 is above the 10 week moving average of $5.00.
*In addition the previous week strong up week was on above average volume which is a bullish signal.
The Negatives:
*The price action on the weekly chart is currently below the resistance level of $5.10. (See chart)
*On a weekly basis the chart is still within a down trend, with a close above $ 5.60 - $5.70 required for confirmation.
*The 10 week moving average is below the 50 week average showing bearish cross.
*Volume on the week just completed was below the average showing that there was a lack of conviction with the move higher.
Overall we would need to see on the weekly chart the price move above $5.70 level with above average volume to confirm that the current reversal taking place is valid.
Reversal Of Downtrend - Daily Chart
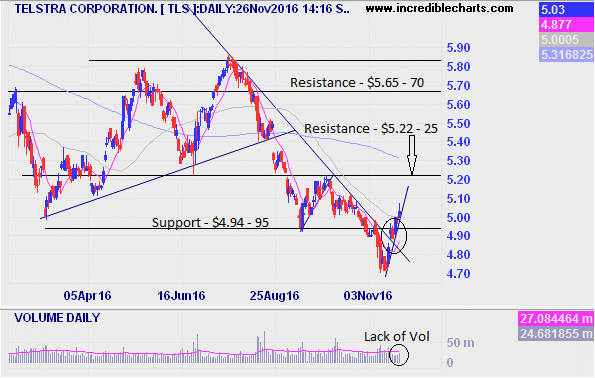
The daily chart is showing good signs of a reversal in trend.
The first important thing to note is that the downtrend that started back in July this year has ended, as the current price is clearly above the downtrend line. (See circle in chart below)
The closing price on Friday of $5.03 is now above the previous resistance level, which is now the new support of $4.94. Its important to stay above this level to confirm the reversal.
Lastly the price is above the 10 and the 50 day moving average which is also a bullish sign.
Caution Ahead - Where Is The Volume?
One of the most important things in trading after the price action is volume. Whenever you are trading and you are looking to go long (price to go higher) its essential that you have above average volume for confirmation to ensure the market is behind you with your trade. You want to be with the herd to catch the biggest moves not against it.
If you take a look at the chart, I have circled the volume below. With the last 5 days trading volume all below the daily average volume. This is a bearish signal.
Because there is a lack of conviction with buyers on the daily chart, I would wait for the chart to move above the next level of resistance at $5.22 - 25 with an accompanying above average volume to confirm the reversal has taken place.
There is a high possibility that Telstra could fall back within the down trend and close below support of $4.94 in the short term due to a lack of volume with the current price action.
Disclaimer: This post was for educational purposes only, and all the information contained within this post is not to be considered as advice or a recommendation of any kind. If you require advice or assistance please seek a licensed professional who can provide these services.


