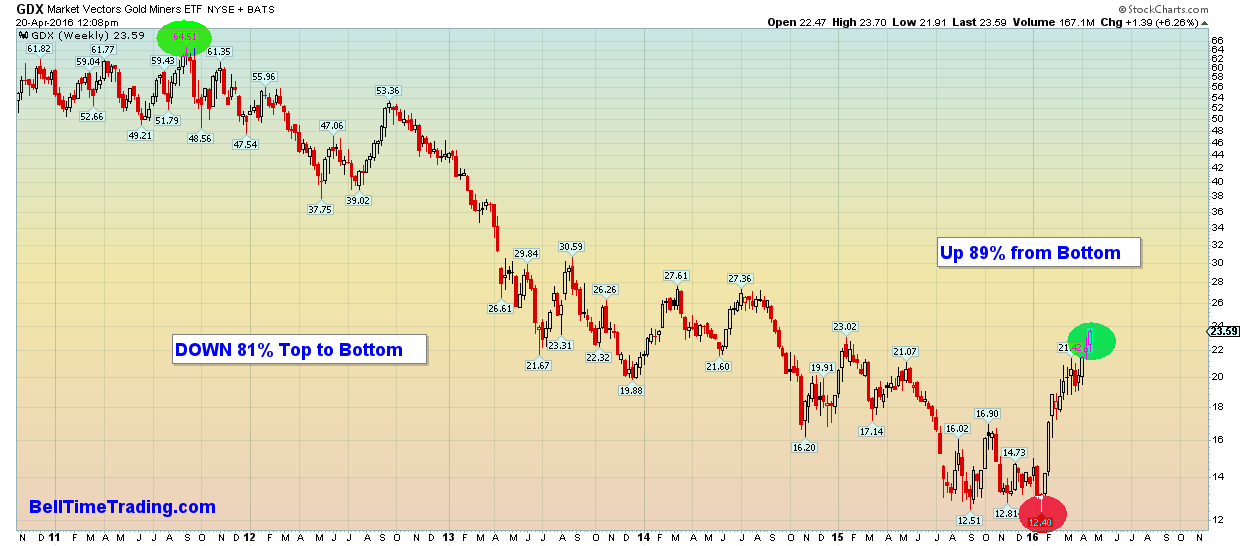
At the moment I am writing this, Market Vectors Gold Miners (NYSE:GDX) ETF is trading at $23.74. That is 91.45% up from the low made on January 19th this year. Long-term view is 90% up in 3 months. Amazing move, though it pales in comparison to the bear market that preceded it. GDX went down from $64.51 to $12.40 over more than 4 years. 
Current up move, as huge as it is, has only retraced around 1/5 of the down move (math can be deceiving). The run up is very typical for the 1st leg of a new bull market, very strong and straight up without any significant pull-backs, not giving much chance for bears to cover or new money to buy in. Everybody is waiting for the pullback that never comes, and eventually they give up and buy high, which results in a climax short-term top.
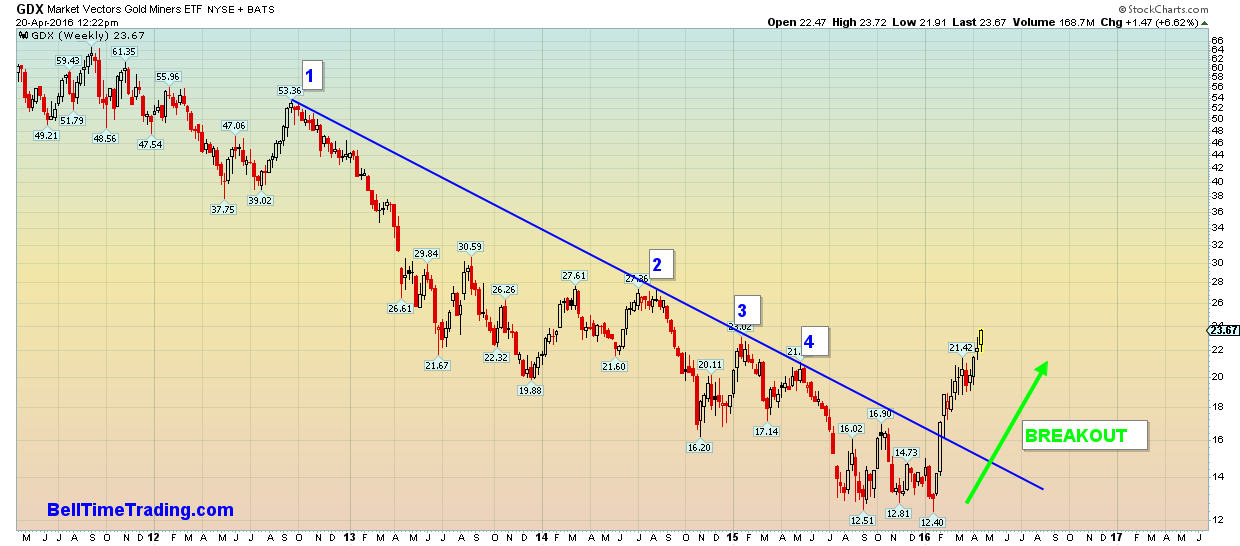
The clues in GDX were that it has been trading against trendline resistance since the summer of 2014, providing two very good shorting opportunities with number 3 and number 4 in the chart below. Trendlines are usually only useful for the 3rd point trade, but this one was fruitful for one more. Once it made the double bottom in January this year and rallied toward the trendline, it was a good clue that the trend is changing. When it finally broke out (just above $16 level) it never looked back. Very strong moves since.

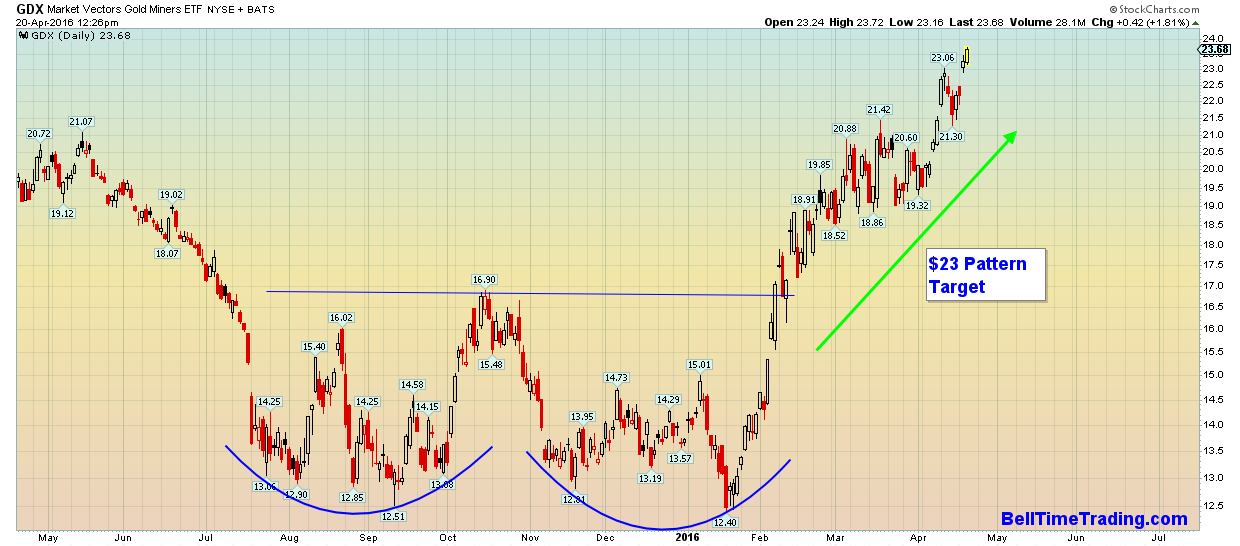
Another clue was clearly seen on the daily chart in the form of a double bottom pattern, as seen in the chart below. The signal triggered at $16.90.
Current price has exceeded the pattern target. The roadmap move from the January lows is in my opinion impulsive, and likely the first leg of a new multi-year bull market. However, it has gone very high in a very short period, making it very overbought.

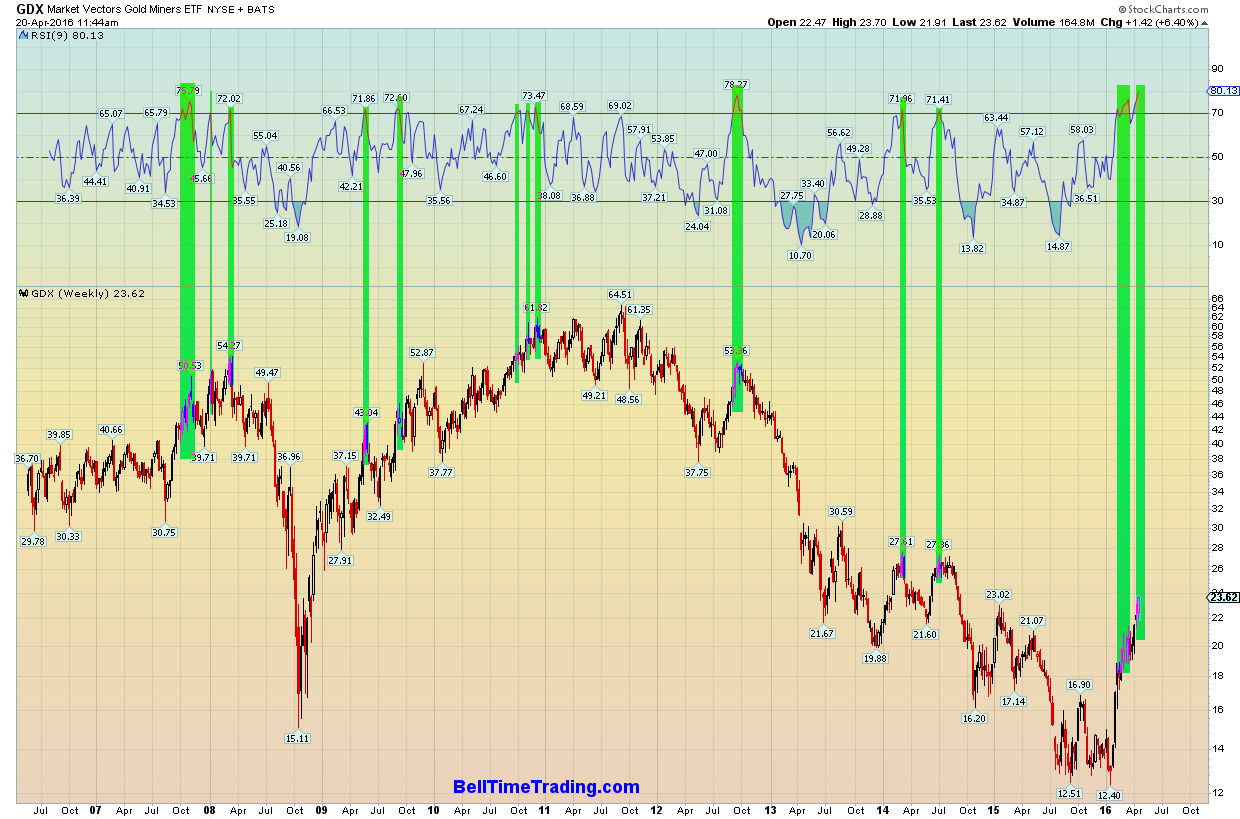
The above chart shows previous weekly RSI9 readings above 70. All were followed by some degree of a down move, and current conditions are the most extreme among all observed. The strength of the move indicates further strength longer term, but likely a corrective move first in the short term.
I am long Anglogold Ashanti Ltd (NYSE:AU) at the moment, and will scale down here within the long-term strategy and take profit within the short-term strategy, while keeping an eye on it to add back on a pull-back.
Disclaimer: This is not investment advice. All information should be used for educational and informational purposes only.
