Stocks have had a mixed week as we kick off Q4 earnings season. Alcoa, the aluminium producer announced fairly good earnings, but all has not been well at Microsoft who issued a warning that sales may not meet Q4 forecasts.
However, this week is notable for stocks since global blue chip companies have joined other risky assets like the Aussie dollar in breaking away from the euro and proving fairly resilient to escalating sovereign tensions in Europe. Instead stocks have shown a greater sensitivity to positive growth signals coming from the US. This is a development we will watch closely.
Stocks took a battering in 2011, so has the sell-off gone far enough and could we see a rally in 2012? That all depends on a few external variables that will drive consumer and economic confidence and thus corporate profits. The first is the Eurozone debt crisis. This decimated global confidence, which caused such sharp sell offs in stocks and other risky assets last year, the next is the US economy keeping up its momentum. If Europe was to implode then we don’t think the US could escape unscathed, but if the currency bloc can continue to muddle through and eventually find a solution to the debt crisis then we could see the US continue to recover. There are a lot of uncertainties for stocks, so don’t expect the next few weeks and months to show any clear direction.
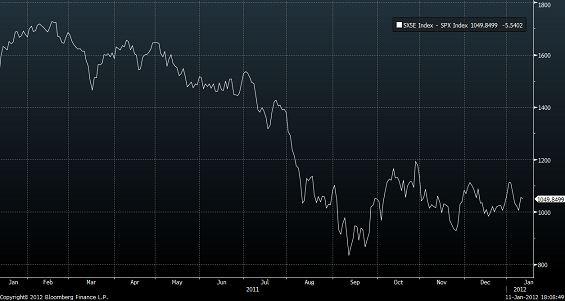
These might not be the perfect conditions for a rally, but there are some positive signs. The rate at which the Eurostoxx 50 has underperformed the SPX has slowed sharply in recent weeks, which suggests that maybe the European sell-off has gone far enough. The chart below shows the spread – as you can see the spread reached a peak in September and has been trading sideways since November. This doesn’t mean that we are about to see a rebound in European equities, but it is one sign that maybe we have reached a bottom, for now anyway, and we could see some temporary respite in the coming weeks.
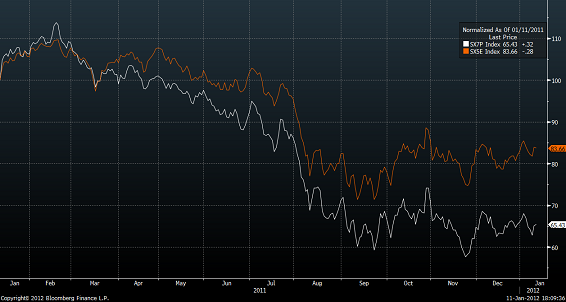
The future of the ESTX 50 depends on a recovery in the Eurozone’s banking sector. Europe’s banks have been hit hard by the sovereign debt crisis and as we enter 2012 need to re-build capital levels, shrink their size and deal with the sovereign debt swamping their balance sheets. None of which is typically good for a share price. However, the question is if markets, which are notoriously forward-looking, have priced in all of the bad news already? Could stocks rise if investors believe that in 6-months’ time banks will be stronger with their bulky new capital buffers? The ESTX 50 banking sector has a strong positive correlation with the ESTX 50 index as you can see in the chart below, which has been normalised to show how the two move together. Banks look like they have made a temporary bottom, but don’t look strong enough to embark on a prolonged uptrend, which could keep ESTX 50 gains capped for now. We may need to see the outcome of the Jan 30th EU summit and some idea on how policy-makers will deal with this crisis before stocks can break out of their current ranges.
Technical deep dive:
SPX 500:
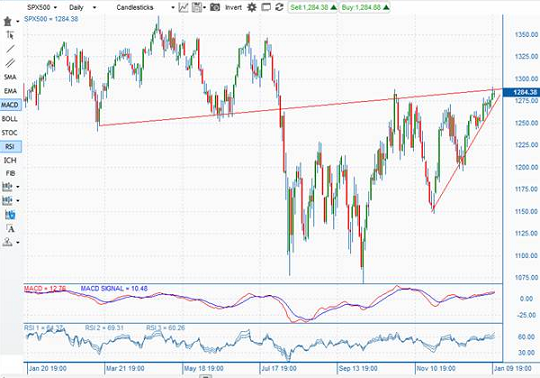
This index has had a strong start to the year, breaking above its 200-day sma at 1,258. The next resistance level of note is the 1,300 mark and it is currently trading just below 1,290. If we can break above 1,300 then the 1,350 high comes back into view. We think that 1,300 could be a sticky level for this index as it is neckline resistance dating back to the H&S pattern from March 2011. However, as you can see in the chart below an ascending triangle pattern seems to be forming, which suggests this pair could break out above 1,300 however it may take a few runs before new, higher ground is broken. Once that is reached it may be a good time to establish new longs as it would suggest a new leg higher for SPX 500. On a fundamental basis we need good retail sales and consumer confidence data on Thursday and Friday to help sustain the SPX back to 1,300, in our view. 
GER 30:
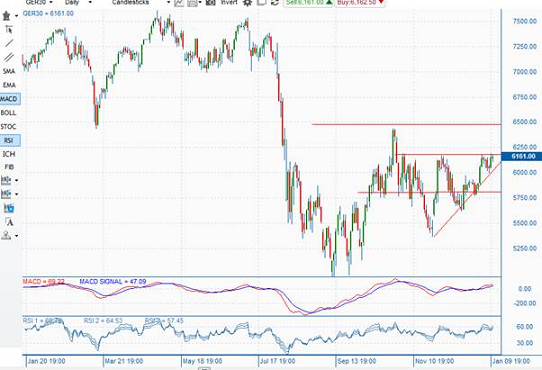
The German Dax index has also had a fairly good start to 2012 and a similar ascending triangle pattern may be forming. The top on two occasions in the past month has been 6,200, and currently the index is trading in a tight 200 pip range. If we can break out of here then the first target is 6,400, the 200-day sma, then 6,500. Support lies at 6,000 then 5,888 – the 50-day sma.
We do expect 6,200 to be a noisy, messy level for the Dax. The German index is likely to be more sensitive to weak economic data from Europe and any developments on the sovereign debt front, so upcoming risk events like debt auctions and policy meetings with EU leaders could dent the attempts of the bulls to break through this resistance zone. However, a dovish ECB on Thursday could help fuel equity gains. Although we don’t think that ECB President Draghi will announce formal QE he may announce that the Bank’s liquidity support for the financial sector will be on-going. This extra money doesn’t seem to be flowing through to the wider economy of Europe; instead it is being parked at the ECB for pathetically low rates of interest. Sooner or later some bright spark at a bank may suggest this money is put to work in the markets, which is positive for equities including the Dax. 
- English (UK)
- English (India)
- English (Canada)
- English (Australia)
- English (South Africa)
- English (Philippines)
- English (Nigeria)
- Deutsch
- Español (España)
- Español (México)
- Français
- Italiano
- Nederlands
- Português (Portugal)
- Polski
- Português (Brasil)
- Русский
- Türkçe
- العربية
- Ελληνικά
- Svenska
- Suomi
- עברית
- 日本語
- 한국어
- 简体中文
- 繁體中文
- Bahasa Indonesia
- Bahasa Melayu
- ไทย
- Tiếng Việt
- हिंदी
Is the Bad News for Stocks Priced in Already?
Published 01/12/2012, 06:18 AM
Updated 05/18/2020, 08:00 AM
Is the Bad News for Stocks Priced in Already?
Latest comments
Loading next article…
Install Our App
Risk Disclosure: Trading in financial instruments and/or cryptocurrencies involves high risks including the risk of losing some, or all, of your investment amount, and may not be suitable for all investors. Prices of cryptocurrencies are extremely volatile and may be affected by external factors such as financial, regulatory or political events. Trading on margin increases the financial risks.
Before deciding to trade in financial instrument or cryptocurrencies you should be fully informed of the risks and costs associated with trading the financial markets, carefully consider your investment objectives, level of experience, and risk appetite, and seek professional advice where needed.
Fusion Media would like to remind you that the data contained in this website is not necessarily real-time nor accurate. The data and prices on the website are not necessarily provided by any market or exchange, but may be provided by market makers, and so prices may not be accurate and may differ from the actual price at any given market, meaning prices are indicative and not appropriate for trading purposes. Fusion Media and any provider of the data contained in this website will not accept liability for any loss or damage as a result of your trading, or your reliance on the information contained within this website.
It is prohibited to use, store, reproduce, display, modify, transmit or distribute the data contained in this website without the explicit prior written permission of Fusion Media and/or the data provider. All intellectual property rights are reserved by the providers and/or the exchange providing the data contained in this website.
Fusion Media may be compensated by the advertisers that appear on the website, based on your interaction with the advertisements or advertisers.
© 2007-2024 - Fusion Media Limited. All Rights Reserved.
