
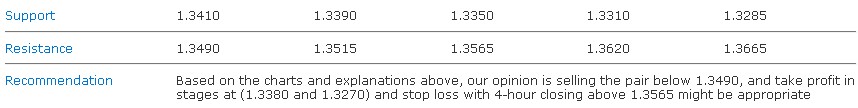
EUR/USD
4-hour closing below 1.3515 was sufficient to confirm the extension of the downside movement, and currently the pair is moving towards 1.3380, which represents 78.6% Fibonacci correction of the upside movement that started from the bottom of 1.3145 reaching the top at 1.4247, where the downside movement is supported by the bearish Head and Shoulders pattern. The pair may not settle for 1.3380 and could extend the downside movement towards 88.6% Fibonacci correction at 1.3270 in case it was able to breach the first correction mentioned before. Therefore, we expect a downside movement to control the pair today, while consolidation below 1.3515 supports our negative outlook, but stability above 1.3665 again could negate our negative expectations, where this level represents the neckline of the bearish structure.
The trading range for today is among the major support at 1.3270 and the major resistance at 1.3665.
The short-term trend is to the upside with steady daily closing above 1.2795 targeting 1.5135
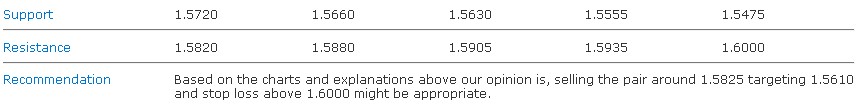
GBP/USD
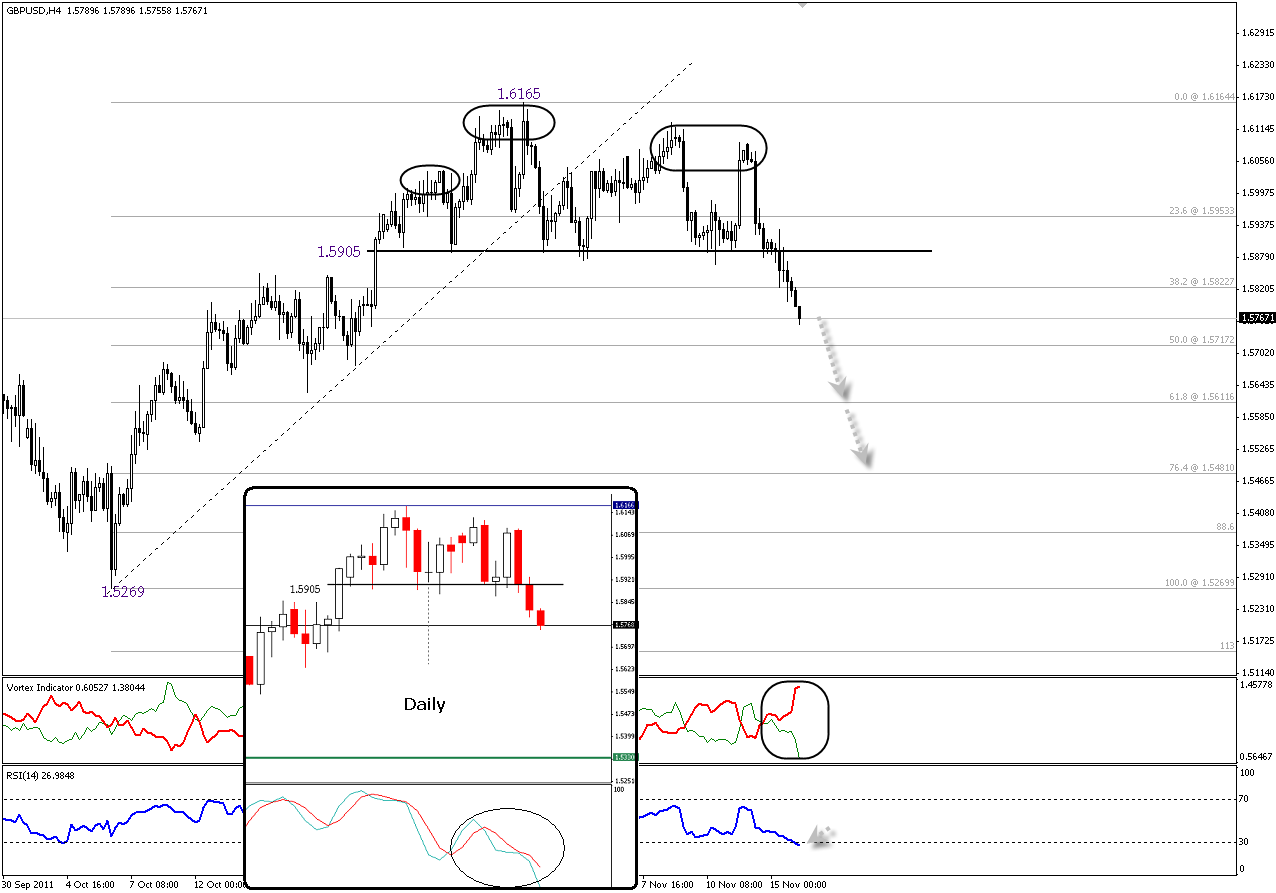
Respecting our classical series, Cable has collapsed violently during the Asian session where it succeeded in breaching through 38.2% Fibonacci retracement of the upside wave from 1.5270 to 1.6165 as seen on the main four-hour chart. Now, the path is clear towards 61.8% level while 1.5720 represents a potential support that may cause fluctuation; noting that RSI 14 will help this level to slow down the bearishness. The allover trajectory is still bearish since the daily basis shows how Stochastic is on its way to the downside. Assessing trend indicators, Vortex over four-hour time scale reflects the strength of the descending wave. We will not talk about the extended technical targets of the classical pattern until we see Cable beating 61.8% Fibonacci retracement.
The trading range for today is among key support at 1.5475 and key resistance at 1.6000.
The general trend over short term basis is to the downside targeting 1.4225 as far as areas of 1.6875 areas remain intact.
USD/JPY
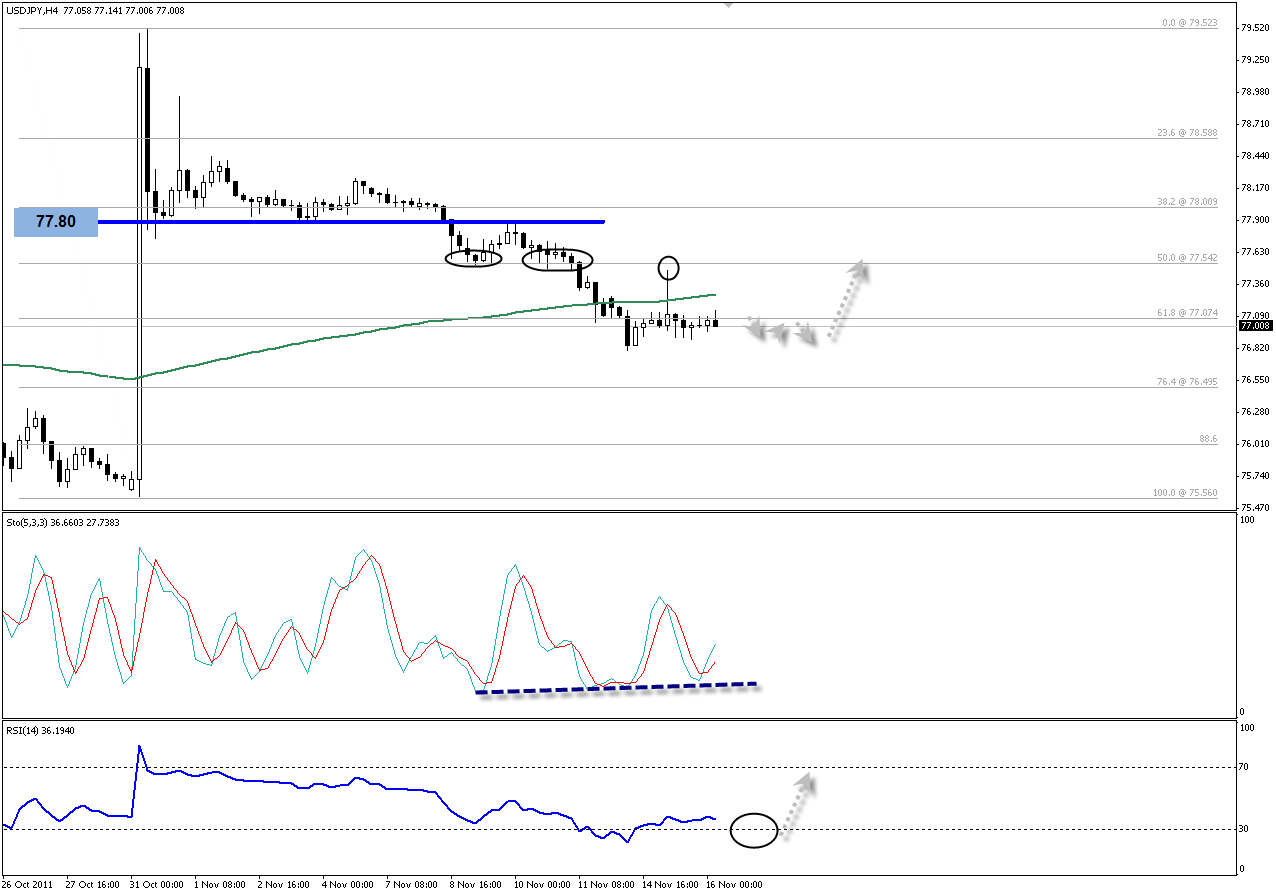
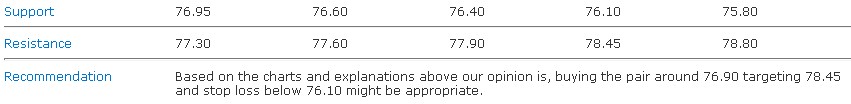
The pair has been trapped within a very tight range hovering around 61.8% Fibonacci retracement of the entire upside movements from 75.50 to 79.50 as seen on the provided four-hour graph. At the same time, Stochastic succeeded in achieving the awaited positive crossover which may assist the pair to re-attack 77.50 zones once more. The current consolidation may continue until the pair penetrates SMA 100 followed by 77.80. To recap, our bullish expectations remain intact so long as 76.10 provide the pair with the support it needs.
The trading range for today is among key support at 76.10 and key resistance now at 78.45.
The general trend over short term basis is to the upside targeting 87.45 as far as areas of 75.20 remain intact.
USD/CHF
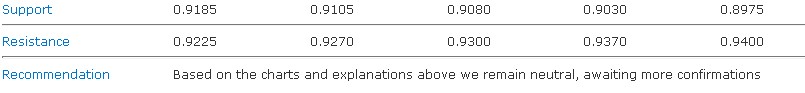
The pair is currently approaching the first potential reversal zone of the suggested Butterfly harmonic pattern. The pattern wasn’t confirmed yet, but the pair reached around 0.9210, which is a critical barrier that separates between testing the (D2) point and settling for the current areas around D1 that could lead the pair to start a downside correction. We remain neutral in our morning report, observing the pair’s behavior in the range of 0.9210-0.9225.
The trading range for today is among the major support at 0.8975 and the major resistance at 0.9400.
The short-term trend is to the upside with steady weekly closing above 0.8020 targeting 0.9400.
USD/CAD
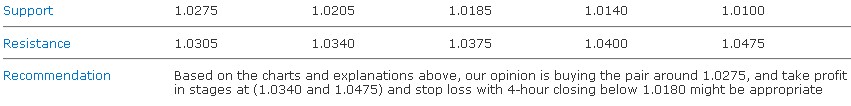
The bullish technical structure supported the retest of areas above the ascending main support shown above in red; while the pair is currently trading above 1.0255, which could support the upside move to extend further during the session today. Momentum indicators also support our expectations, while a breach of 50% Fibonacci correction as shown above on the chart could support the pair to move towards 61.8% Fibonacci correction.
The trading range for today is among the major support at 1.0185 and the major resistance at 1.0495.
The short-term trend is to the downside as far as 1.0665 remains intact targeting 0.9000.
4-hour closing below 1.3515 was sufficient to confirm the extension of the downside movement, and currently the pair is moving towards 1.3380, which represents 78.6% Fibonacci correction of the upside movement that started from the bottom of 1.3145 reaching the top at 1.4247, where the downside movement is supported by the bearish Head and Shoulders pattern. The pair may not settle for 1.3380 and could extend the downside movement towards 88.6% Fibonacci correction at 1.3270 in case it was able to breach the first correction mentioned before. Therefore, we expect a downside movement to control the pair today, while consolidation below 1.3515 supports our negative outlook, but stability above 1.3665 again could negate our negative expectations, where this level represents the neckline of the bearish structure.
The trading range for today is among the major support at 1.3270 and the major resistance at 1.3665.
The short-term trend is to the upside with steady daily closing above 1.2795 targeting 1.5135
GBP/USD
Respecting our classical series, Cable has collapsed violently during the Asian session where it succeeded in breaching through 38.2% Fibonacci retracement of the upside wave from 1.5270 to 1.6165 as seen on the main four-hour chart. Now, the path is clear towards 61.8% level while 1.5720 represents a potential support that may cause fluctuation; noting that RSI 14 will help this level to slow down the bearishness. The allover trajectory is still bearish since the daily basis shows how Stochastic is on its way to the downside. Assessing trend indicators, Vortex over four-hour time scale reflects the strength of the descending wave. We will not talk about the extended technical targets of the classical pattern until we see Cable beating 61.8% Fibonacci retracement.
The trading range for today is among key support at 1.5475 and key resistance at 1.6000.
The general trend over short term basis is to the downside targeting 1.4225 as far as areas of 1.6875 areas remain intact.
USD/JPY
The pair has been trapped within a very tight range hovering around 61.8% Fibonacci retracement of the entire upside movements from 75.50 to 79.50 as seen on the provided four-hour graph. At the same time, Stochastic succeeded in achieving the awaited positive crossover which may assist the pair to re-attack 77.50 zones once more. The current consolidation may continue until the pair penetrates SMA 100 followed by 77.80. To recap, our bullish expectations remain intact so long as 76.10 provide the pair with the support it needs.
The trading range for today is among key support at 76.10 and key resistance now at 78.45.
The general trend over short term basis is to the upside targeting 87.45 as far as areas of 75.20 remain intact.
USD/CHF
The pair is currently approaching the first potential reversal zone of the suggested Butterfly harmonic pattern. The pattern wasn’t confirmed yet, but the pair reached around 0.9210, which is a critical barrier that separates between testing the (D2) point and settling for the current areas around D1 that could lead the pair to start a downside correction. We remain neutral in our morning report, observing the pair’s behavior in the range of 0.9210-0.9225.
The trading range for today is among the major support at 0.8975 and the major resistance at 0.9400.
The short-term trend is to the upside with steady weekly closing above 0.8020 targeting 0.9400.
USD/CAD
The bullish technical structure supported the retest of areas above the ascending main support shown above in red; while the pair is currently trading above 1.0255, which could support the upside move to extend further during the session today. Momentum indicators also support our expectations, while a breach of 50% Fibonacci correction as shown above on the chart could support the pair to move towards 61.8% Fibonacci correction.
The trading range for today is among the major support at 1.0185 and the major resistance at 1.0495.
The short-term trend is to the downside as far as 1.0665 remains intact targeting 0.9000.