The decline in Crude Oil over the past 18-months has been historic. It's the largest 18-month decline in the commodity ever. Crude remains in our opinion, the most important commodity in the world and its relentless decline is of concern, on a macro basis.
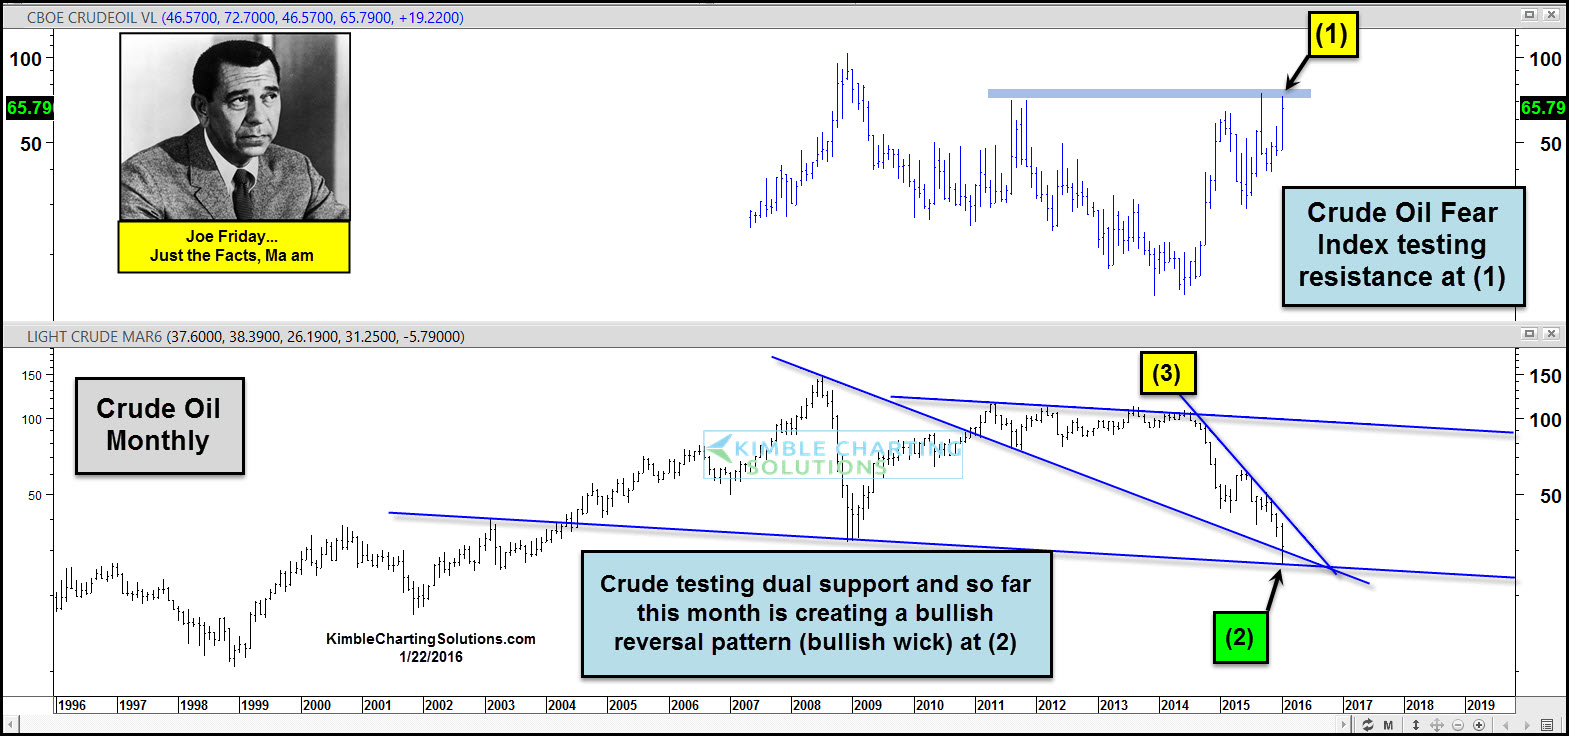
The chart above looks at Crude Oil and its Fear Index, on a monthly basis. Fear index has peaked a few times when it hit lofty levels at line (1) above
So far this month, Crude Oil is creating a bullish reversal pattern (bullish wick pattern) at channel support at (2) above.
This is a monthly chart, so where it stands at the end of the month will be critical for this pattern. Crude could also be creating a bullish falling wedge pattern. To prove this pattern read is correct, Crude Oil needs to break above falling resistance line (3), which is still a large percentage above current prices.
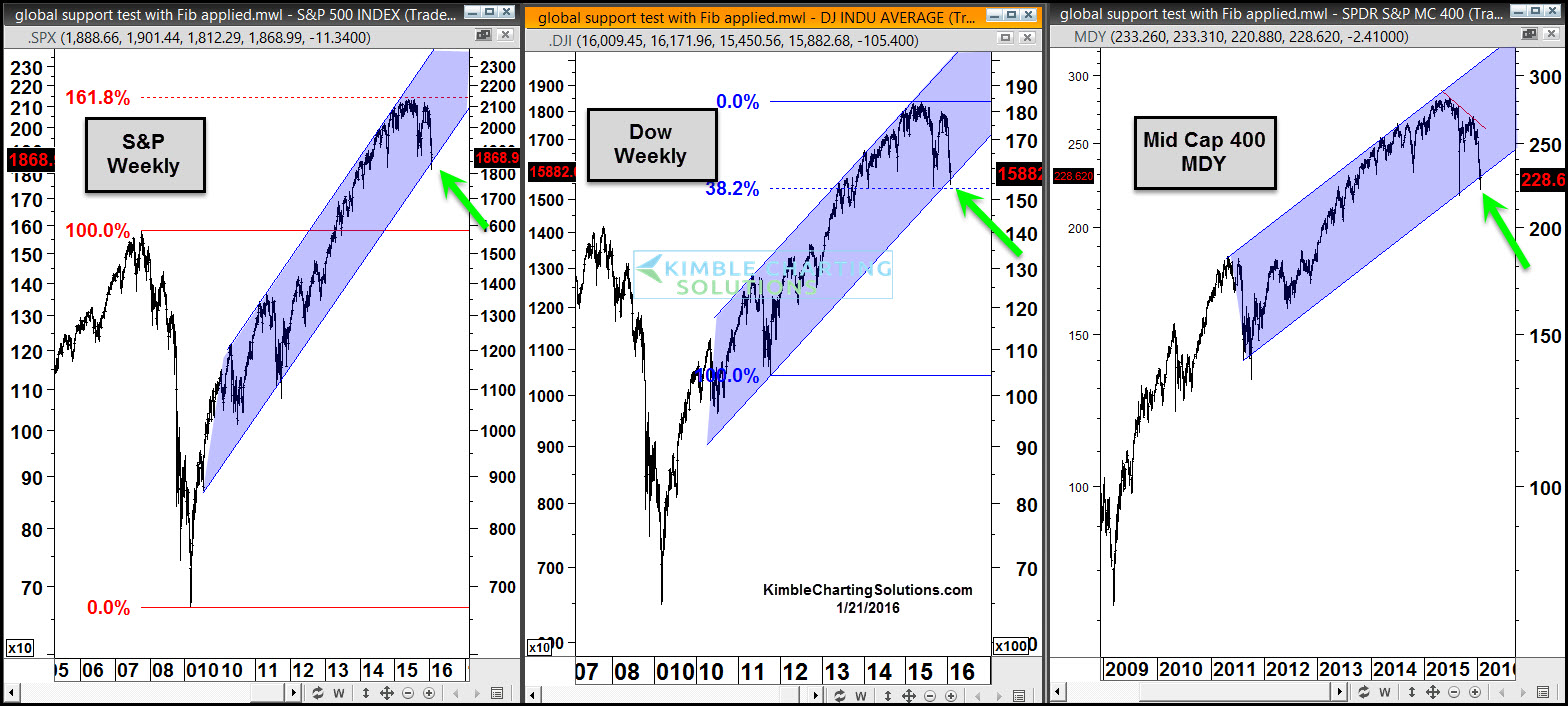
Crude is testing support at the same time as stock indices in the US are doing the same below:
From a Power of the Pattern perspective, I find it very interesting that Crude is testing support and that stock markets around the world, are doing the same. The 5-year rising bull trend in stocks, has NOT been broken, so far.
For sure, if support would give in Crude and the Stock market, bulls should be pretty concerned.


