The euro picked up steam yesterday after the dollar weakened following the unimpressive fiscal stimulus package from Shinzo Abe and the lackluster inflation data in the US. With the rally to 1.120 now complete, EUR/USD is likely to sit back and await this Friday’s NFP data.
Today’s main event is the ADP payrolls, which is likely to set the tone heading into this Friday’s jobs report. Gold prices are also sitting near a key resistance level, and unless we see a strong bullish breakout above 1360, the bias remains to the downside.
EUR/USD Daily Analysis

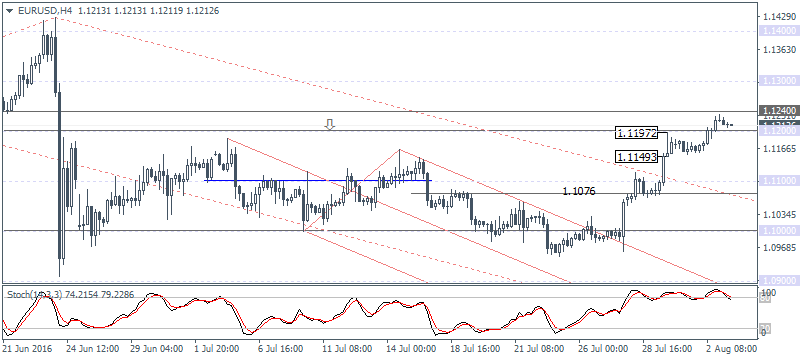
EUR/USD (1.1212): EUR/USD finally rallied to the 1.120 resistance level, which was mentioned over the past few weeks. Price action is likely to stay limited at the current levels, within 1.1240 - 1.120 resistance zone.
On the daily chart, the Stochastics points to a hidden bearish divergence, with the higher lowbeing formed against price's lower high. We can expect the downside to resume over the next few daily sessions. Initial support is seen at 1.110 - 1.1076 followed by the next main support identified at 1.10.
USD/JPY Daily Analysis

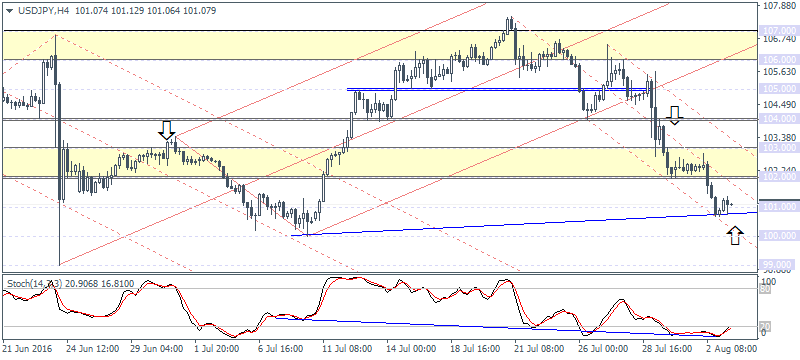
USD/JPY (101.07): USD/JPY broke down below the 102 support level to test the lower support at 101. The Stochastics on the 4-hour chart continues to point to a hidden bullish divergence, but USD/JPY will have to bounce off the current 101 and clear the overhead resistance at 102 to confirm any more further upside in prices.
If 102 turns to resistance and keeps a lid on the gains, USD/JPY could weaken to the 100 psychological price level. Either way, watch for a higher low in USD/JPY on the 4-hour chart for an early confirmation of a move to the upside.
GBP/USD Daily Analysis

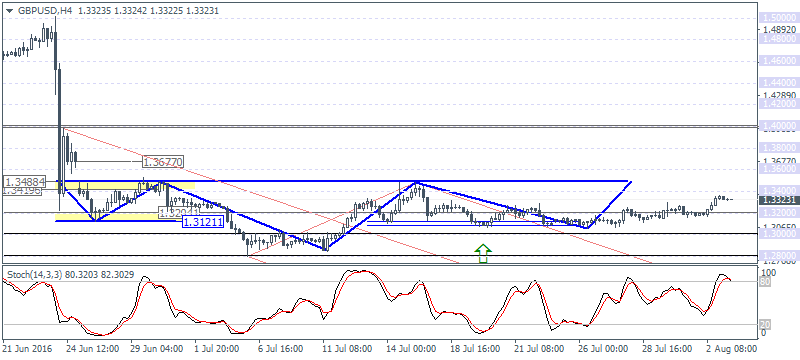
GBP/USD (1.332): GBP/USD posted strong gains yesterday with price breaking above 1.32 price level. The daily chart shows the potential inverse head and shoulders, with the right shoulder confirmed near the lows of 1.3121 - 1.320. Further gains are likely to continue towards the neckline resistance near 1.34 - 1.3488.
Watch for a daily close above 1.34 in order to confirm further gains to the upside. Alternately, if GBPUSD falls back below 1.32, we can expect the declines to push lower towards 1.30.
Gold Daily Analysis

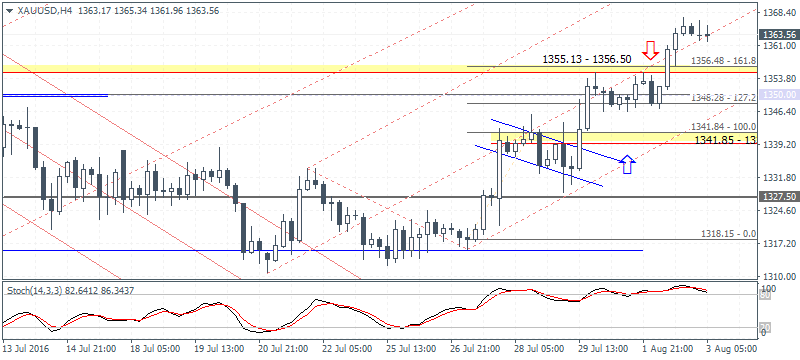
XAU/USD (1363.56): Gold prices posted strong gains yesterday retesting the 1350 resistance. Price closed above the 1360 level, but further upside can be confirmed only on a convincing close above 1360. On the 4-hour chart, we notice a strong hidden bearish divergence in gold prices which could signal a near-term weakness.
Watch for a breakdown below 1355 - 1356 support level in order to confirm the correction to the downside. The next main support comes in at 1348 - 1350 level followed by 1300.
