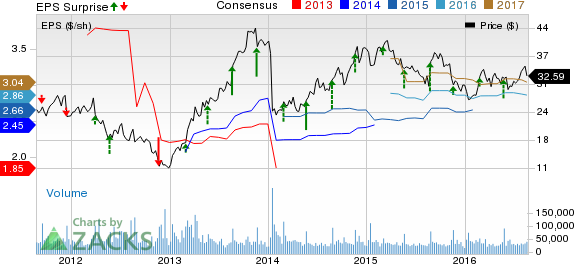
Best Buy Company, Inc. (NYSE:BBY) reported better-than-expected second-quarter fiscal 2017 results. The company reported earnings per share of 57 cents, which beat the Zacks Consensus Estimate of 42 cents and also increased 16.3% year over year. Notably, this is the fourteenth consecutive quarter in which the company’s earnings have surpassed estimates. Following the results, the company’s shares jumped nearly 16% during pre-market trading session.
Including one-time items and discontinued operations, quarterly earnings per share came in at 61 cents compared with 46 cents in the year-ago quarter.
Revenues of $8,533 million also surpassed the Zacks Consensus Estimate of $8,401 million and inched up 0.1% year over year. Comparable-store sales (comps) were up 0.8% as against a rise of 3.8% in the prior-year period.
Gross profit declined 1.7% to $1,962 million and gross margin contracted 40 basis points (bps) to 24.2%. Operating profit came in at $289 million, flat year over year. On the other hand, operating margin was 2.9%, flat year over year.
Segment Details
Domestic segment revenues inched up 0.1% year over year to $7,889 million, primarily due to a 0.8% rise in comparable sales, marginally overshadowed by a loss of revenues from 12 large-format as well as 22 Best Buy Mobile store shut downs.
Comparable-online sales surged 23.7% to $835 million. The upside was driven by improved traffic and conversion rates.
The segment’s adjusted gross profit declined 2.1% to $1,895 million during the quarter. Adjusted margin came in at 24% compared with 24.6% in the prior-year quarter due to effective promotional strategy. Adjusted operating income decreased 7.3% to $290 million whereas adjusted margin contracted 30 bps to 3.7%.
International segment revenues fell 0.9% to $644 million due to the negative impact of foreign currency exchange rate. On a constant currency basis, the company’s international segment revenues jumped 4.1% driven by growth in Canada and Mexico.
The segment’s adjusted gross profit rose 12.1% to $167 million in the quarter and gross margin increased 300 bps to 25.9%. Adjusted operating profit came in at $3 million. The company had recorded an operating loss of $21 million in the year-ago period.
Other Financial Details
Best Buy ended the quarter with cash and cash equivalents of $1,861 million, long-term debt of $1,341 million and total equity of $4,319 million.
On Feb 25, 2016, the company’s board of directors announced a plan to repurchase shares worth $1 billion over the next two years. In the fiscal first quarter, the company repurchased 7.1 million shares for $219 million.
Guidance
For the fiscal third quarter, management forecasts Enterprise revenues between $8.8 billion and $8.9 billion, reflecting a flat to 0.1% increase from the prior year. Comparable sales are expected to increase nearly 1%. Management projects earnings in the range of 43–47 cents per share compared with 41 cents in the prior-year quarter. The current Zacks Consensus Estimate for the fiscal third quarter is pegged at 45 cents.
Also in the fiscal third quarter, the company expects international revenues in the range of flat to down 5%.
Zacks Rank
Best Buy holds a Zacks Rank #2 (Buy). Some other stocks which warrant a look in this sector include The Children's Place, Inc. (NASDAQ:PLCE) , Urban Outfitters Inc. (NASDAQ:URBN) and Citi Trends, Inc. (NASDAQ:CTRN) . The Children's Place and Urban Outfitters hold a Zacks Rank #1 (Strong Buy), while Citi Trends has a Zacks Rank #2.
URBAN OUTFITTER (URBN): Free Stock Analysis Report
CITI TRENDS INC (CTRN): Free Stock Analysis Report
CHILDRENS PLACE (PLCE): Free Stock Analysis Report
BEST BUY (BBY): Free Stock Analysis Report
Original post
Zacks Investment Research

