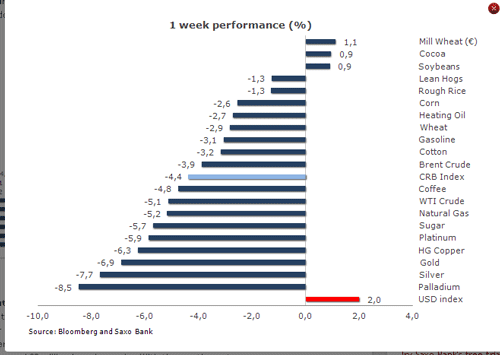
The major commodity indices followed stocks lower this week, posting their biggest drop in nearly three months, as investors increasingly moved into cash with the two major investment markets - oil and gold - both suffering heavy losses. The dollar meanwhile moved to an 11-month high against the Euro, as funding stress among European banks increased, thereby eroding support for commodities priced in dollars.
OPEC unity restored but oil tanks
Ahead of the OPEC meeting oil prices had remained relatively firm while losses were seen across other commodity markets. This firmness only lasted until the end of the meeting where its members returned to unity by deciding to cap the daily OPEC output around 30 million barrels per day. With the meeting out of the way traders returned to focus on the outside markets and this resulted in the biggest one-day drop in nearly three months. The five percent slide occurred on growing worries about weakening oil demand thereby removing some of the risk premium that had been built up over the last month in relation to the stand-off triggered about uncertainties over Iran’s nuclear intentions.
Bumpy ride ahead
With the focus firmly on worries about an economic slowdown the near-term risk to prices points to the downside. Hedge funds have stubbornly held onto speculative long positions over the last few months with the current long position of futures and options amounting to 227 million barrels, some 28 million above the average over the last two years. The rule of thumb is that every 100 million barrel change in speculative length equates to roughly a 10 dollar move in price. Whether the market will allow this bullish approach to be maintained over the next few weeks remains to be seen as further price weakness could trigger additional long liquidation. 
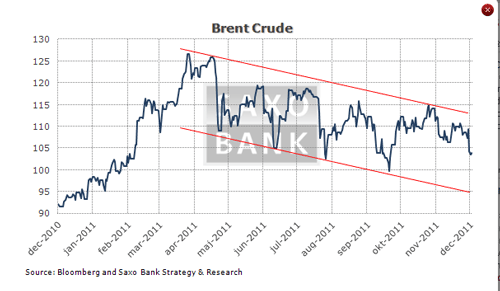
Brent crude has been in a small downtrend since the peak reached back in March and the weakness over the past week has brought the price back to the middle of this downtrend. Given the above factors we see a risk of a test to the lower end of the current range with the October low of 99.1 giving initial support ahead of a potential move down to 95 during January.
Gold below 200 DMA
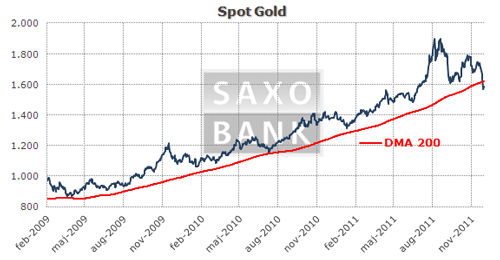
Spot gold crashed through its 200-day moving average on Thursday, a level that previous corrections during the last three years failed to break. In Europe politicians are still as far away from a solution as they have ever been and this has seen the dollar rally further and increased the gloom about the global economic outlook for 2012. Based on this Gold has once again been put into the risky asset category with speculative investors, given the time of year, adopting a very short-term investment horizon with loss making positions being closed much quicker than normal. Money managers are increasingly moving to the sideline into cash as they wait until the New Year before new investment decisions will be made.
Demand for Exchange Traded Funds continues nevertheless with total known holdings reaching a new record of 2,360 tonnes as the setback in price is being viewed by this investor segment as a buying opportunity. Once again it remains to be seen if the setback will be met by physical demand just like we experienced during the most recent correction where Central Banks bought record amounts. With most investors already positioned towards higher prices physical demand plays a very important role in order to avoid additional long liquidation ahead of year-end.
The move below 1,619, the 200 day moving average (DMA), has opened up for a re-test of the September low at 1,532 which also co-insides with trend-line support from the 2008 lows. However with the RSI having moved into oversold territory a correction back towards 1,619, which is now resistance, looks very likely.
Nowhere was the selling more apparent than in platinum which dropped to a two-year low and the silver market which has now lost more than 7 percent on the week and trades at the cheapest since February. Silver reached its cheapest relative level to gold in 13 months at 55.3 oz of silver to 1 oz of gold, getting close to its five-year average of 57.3.
Cocoa surges from the lows on reduced supply forecast
The price of cocoa, which up until this week had been languishing near the bottom of the 2011 performance table, surged more than 10 percent on Monday when one of the world’s four biggest traders of cocoa warned that the slump in prices seen during 2011 could trigger reduced production in 2012. This carried the risk of moving the market into a supply deficit with most up until now having seen the market as balanced.
According to the US Commodity Futures Trading Commission hedge funds and other large speculators have been short cocoa futures since early September with last week’s data showing an additional 43 percent increase in net short positions. This helps to explain the price surge as funds were caught short at a time where the market was already technically oversold.
- English (UK)
- English (India)
- English (Canada)
- English (Australia)
- English (South Africa)
- English (Philippines)
- English (Nigeria)
- Deutsch
- Español (España)
- Español (México)
- Français
- Italiano
- Nederlands
- Polski
- Português (Portugal)
- Português (Brasil)
- Русский
- Türkçe
- العربية
- Ελληνικά
- Svenska
- Suomi
- עברית
- 日本語
- 한국어
- 简体中文
- 繁體中文
- Bahasa Indonesia
- Bahasa Melayu
- ไทย
- Tiếng Việt
- हिंदी
Cash Replacing Commodities Ahead of Year-End
Published 12/16/2011, 10:55 AM
Updated 03/19/2019, 04:00 AM
Cash Replacing Commodities Ahead of Year-End
Latest comments
Loading next article…
Install Our App
Risk Disclosure: Trading in financial instruments and/or cryptocurrencies involves high risks including the risk of losing some, or all, of your investment amount, and may not be suitable for all investors. Prices of cryptocurrencies are extremely volatile and may be affected by external factors such as financial, regulatory or political events. Trading on margin increases the financial risks.
Before deciding to trade in financial instrument or cryptocurrencies you should be fully informed of the risks and costs associated with trading the financial markets, carefully consider your investment objectives, level of experience, and risk appetite, and seek professional advice where needed.
Fusion Media would like to remind you that the data contained in this website is not necessarily real-time nor accurate. The data and prices on the website are not necessarily provided by any market or exchange, but may be provided by market makers, and so prices may not be accurate and may differ from the actual price at any given market, meaning prices are indicative and not appropriate for trading purposes. Fusion Media and any provider of the data contained in this website will not accept liability for any loss or damage as a result of your trading, or your reliance on the information contained within this website.
It is prohibited to use, store, reproduce, display, modify, transmit or distribute the data contained in this website without the explicit prior written permission of Fusion Media and/or the data provider. All intellectual property rights are reserved by the providers and/or the exchange providing the data contained in this website.
Fusion Media may be compensated by the advertisers that appear on the website, based on your interaction with the advertisements or advertisers.
© 2007-2024 - Fusion Media Limited. All Rights Reserved.
