Personal spending had its strongest monthly increase in 4 years. The BEA reported that personal consumption expenditures rose an inflation-adjusted .6% in April, which confirms the strong 1.3% rise in retail sales recently reported by Census Bureau. Durable goods purchases – which had been weaker over the last few months – increased a strong 2.2%. Non-durable sales are still increasing weakly, this time rising .7%. And service spending was up .4%. Finally, personal income increased a solid 3.7%.
The Institute for Supply Management released both manufacturing and service reports last week. The PMI was 51.3, with a solid new orders component (down .1 to 55.7) and positive production reading (down 1.6 to 52.6). 12 of 18 industries are expanding. The anecdotal comments are nearly all positive:
- "Business conditions remain strong with the exception of South America. Continued expectation for a strong year even with the headwinds of currency and economic slowdown." (Food, Beverage & Tobacco Products)
- "Consistent sales growth in greater China, North Asia, Southeast Asia, Canada and Mexico. Flat for the Americas and Europe." (Chemical Products)
- "Slowdown in Chinese economy causing low orders." (Computer & Electronic Products)
- "Continued brisk order flow for our business." (Fabricated Metal Products)
- "Steady to slightly up production rates vs. prior month." (Machinery)
- "Business is still good, but slowing." (Transportation Equipment)
- "Business conditions are stable; demand is steady for our products." (Miscellaneous Manufacturing)
- "Our business remains to be strong, but many of my suppliers are telling me their business is flat." (Plastics & Rubber Products)
- "Oil & Gas continues to struggle to meet cost controls required in the new low-oil price environment." (Petroleum & Coal Products)
- "Market is improving steadily in both orders and pricing." (Wood Products)
Oil and gas are still weak and some transportation is a bit soft. Internationally, the EU and South America are weak, but other areas are strong.
The headline number for the ISM Services Index was 52.9. Overall activity was 55.1 and new orders were 54.2. And a majority of industries were growing (14 of 18). But the anecdotal comments contained some areas of weakness:
- "Outlook remains strong, with steady pricing, strong demand, and new expansion in the pipeline." (Accommodation & Food Services)
- "Projects from the oil companies are becoming less and less. Budget problems for capital projects." (Construction)
- "There has been a general slowing-down from the momentum we saw last month." (Professional, Scientific & Technical Services)
- "Slower start to the second quarter." (Arts, Entertainment & Recreation)
- "Holding steady. No real increase, but expansion plans on for late Q3 or Q4 in preparation for 2017." (Finance & Insurance)
- "Continued growth in the sector." (Transportation & Warehousing)
- "Pending labor concerns to replace an aging workforce of highly-skilled staff support positions." (Educational Services)
- "High pressure on cost reduction due to declining top line sales." (Retail Trade)
- "Significant drop in shipments for the month. Estimate a decline of nine percent for the markets we serve. Overall retail traffic has slowed. Pricing has stabilized in the market." (Wholesale Trade)
The oil and gas slowdown continues to create problems. But now technical services are slowing and wholesale trade is seeing a “sharp” slowdown in shipments. Finance and insurance are holding steady instead of seeing a solid increase. The numbers don’t reflect a meaningful slowdown yet. But there is a clear uptick in negative commentary.
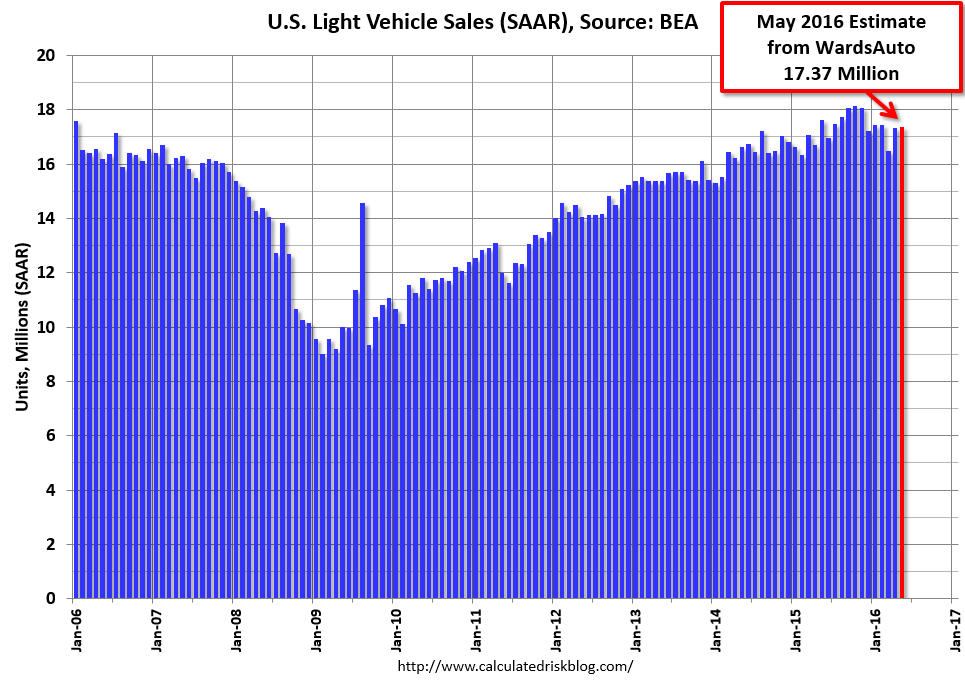
While auto sales are still strong, it’s possible the pace may have topped for this cycle. From Bloomberg:
U.S. auto sales fell in May, marking the second monthly decline this year and reinforcing the idea that the demand for cars and trucks, while still historically robust, has reached a plateau.
The declines at General Motors Co (NYSE:GM), Ford Motor (NYSE:F) and Toyota Motor Corp Ltd Ord (NYSE:TM) were all greater than analysts predicted, sending their shares lower. Industrywide sales dropped 6 percent to 1.54 million, the first decline since January, researcher Autodata Corp. reported.
As shown on the following chart from Calculated Risk, the last 6 readings have been slightly lower:
And then we come to Friday’s jobs report, with a 38,000 headline number – a very large miss. Both manufacturing and service sector growth showed sharp declines. The previous two months were lowered by a combined 59,000. And while the unemployment rate declined to 4.7%, people leaving the labor force were the primary reason for the decline. There was nothing good in the report.
The Atlanta Fed’s GDP Now case predicts 2Q GDP growth of 2.5%, while the NY Fed’s prediction is 2%. An average of these two figures is 2.25%.
Economic Conclusion: this week’s data contains mixed signals. On the positive side, PCEs increased at the strongest rate in 4 years, indicating the consumer’s first quarter spending slowdown was probably temporary. According to ISM sentiment readings, the manufacturing and service sectors are growing. The data becomes grayer with auto sales, which are currently neutral. Although they are still at high levels, they were below previous highs for the sixth consecutive month, indicating they may have peaked for this cycle. The data turns black with Friday’s jobs report which was a huge disappointment. The data is clearly very muddled now.
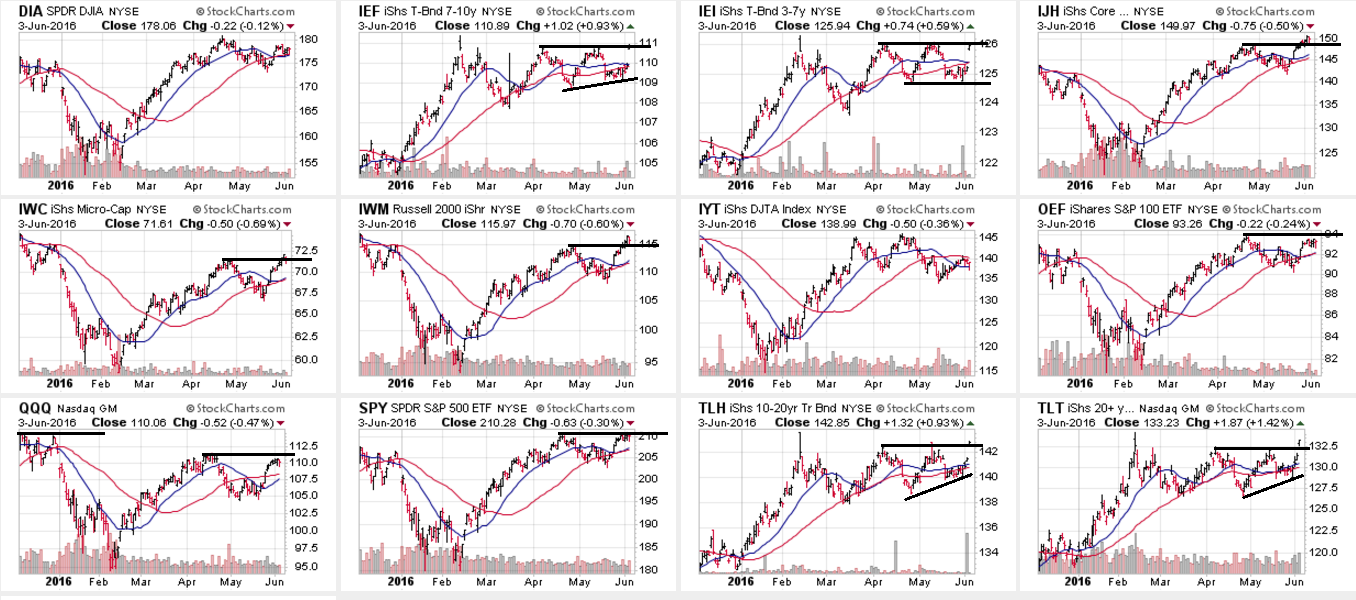
Market Analysis: as with the economic data, the markets are very mixed right now. Below is a group of 6-month candleglance charts from Stockcharts.com:

Notice the following:
- The mid-term treasury ETFs, (NYSE:IEIs and NYSE:IEFs) are consolidating at highs in either a channel or pennant formation. Both closed at or near their upper consolidating trend lines.
- The longer treasury ETFs (NYSE:TLHs and NYSE:TLTs) are consolidating at highs in a wedge pattern. Both closed above their upper consolidating line on Friday.
- (Not pictured) The 30-2 and 10-2 spread is at or near 5-year lows, indicating the treasury market does not believe the Atlanta or NY Fed’s 2Q GDP projection, instead seeing far slower growth.
But, equity markets are telling a bullish story
- The NYSE:IWMs and NYSE:IJHs (small and mid-caps) both closed above recent highs, indicating risk capital is bullish.
- The NYSE:SPYs are again at the 210-212 level, where they have continually found upside resistance over the last year.
Incoming economic data will be the tie breaker. Right now, there is equal data for both camps. But, that will change.

