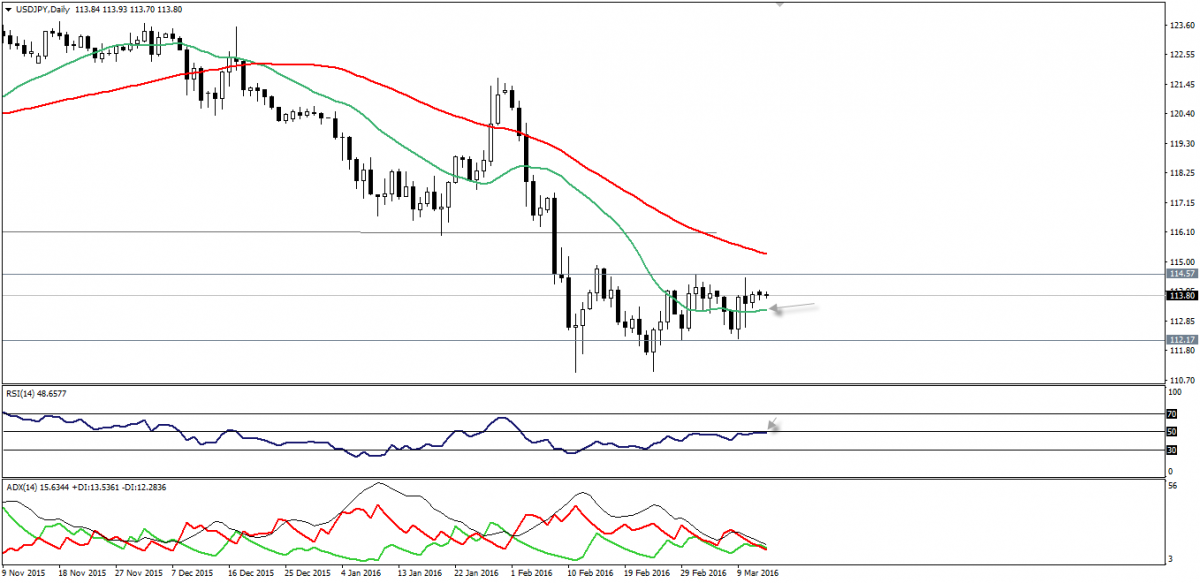
The USD/JPY has moved to the upside as anticipated in the last technical report, where it succeeded in achieving a daily closing above SMA20 at 113.25 as seen on the provided daily chart.

Currently, RSI 14 is touching the momentum resistance of 50.00, which may slow down the bullishness amid lack of important data today.
But, we remain bullish based on stability above 113.25-113.00 zones; noting that, a break above 114.60 will be bullish over short-term basis.
Support: 113.30-113.00-112.50
Resistance: 114.00-114.60-115.00
Direction: Bullish
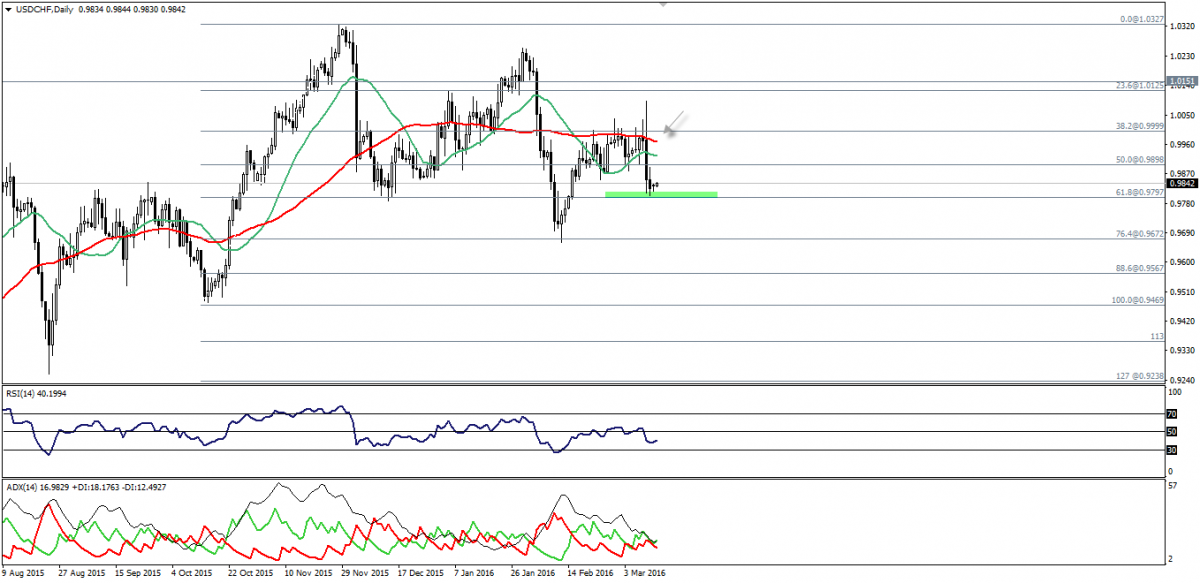
The USD/CHF has ended the last week bearishly after stabilizing below 50% Fibonacci at 0.9898, and below moving averages 20 and 50, as seen on the graph.

The pair has found some kind of support above 0.9800 regions-Fibonacci of 61.8%-, but the bearishness is very strong over weekly studies.
Therefore, we will be bearish as far as 0.9925 regions-SMA20 value- hold, but we need to witness a break below 0.9800 to affirm the bearishness towards next Fibonacci support.
Support: 0.9800-0.9760-0.9725
Resistance: 0.9900-0.9925-0.9950
Direction: Bearish
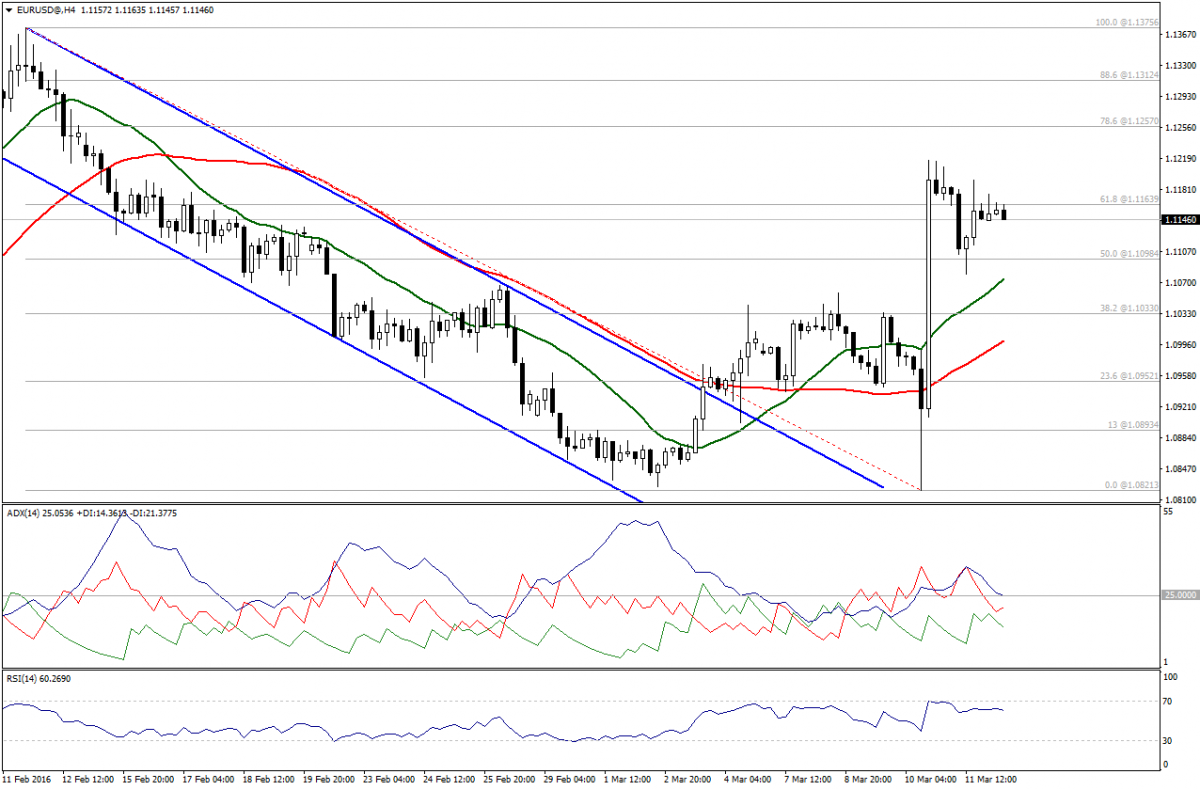
Euro failed to stabilize above 1.1165-Fibonacci of 61.8%- in the Asian session and the pair is trading below it, but above 50% Fibonacci at 1.1095.

Trading between 1.1165 and 1.1095 makes us neutral, as the fluctuation remains too high amid contradiction between technical indicators and moving averages.
Support: 1.1095 – 1.1030 – 1.0950
Resistance: 1.1165 –1.1200 – 1.1260
Direction: Neutral
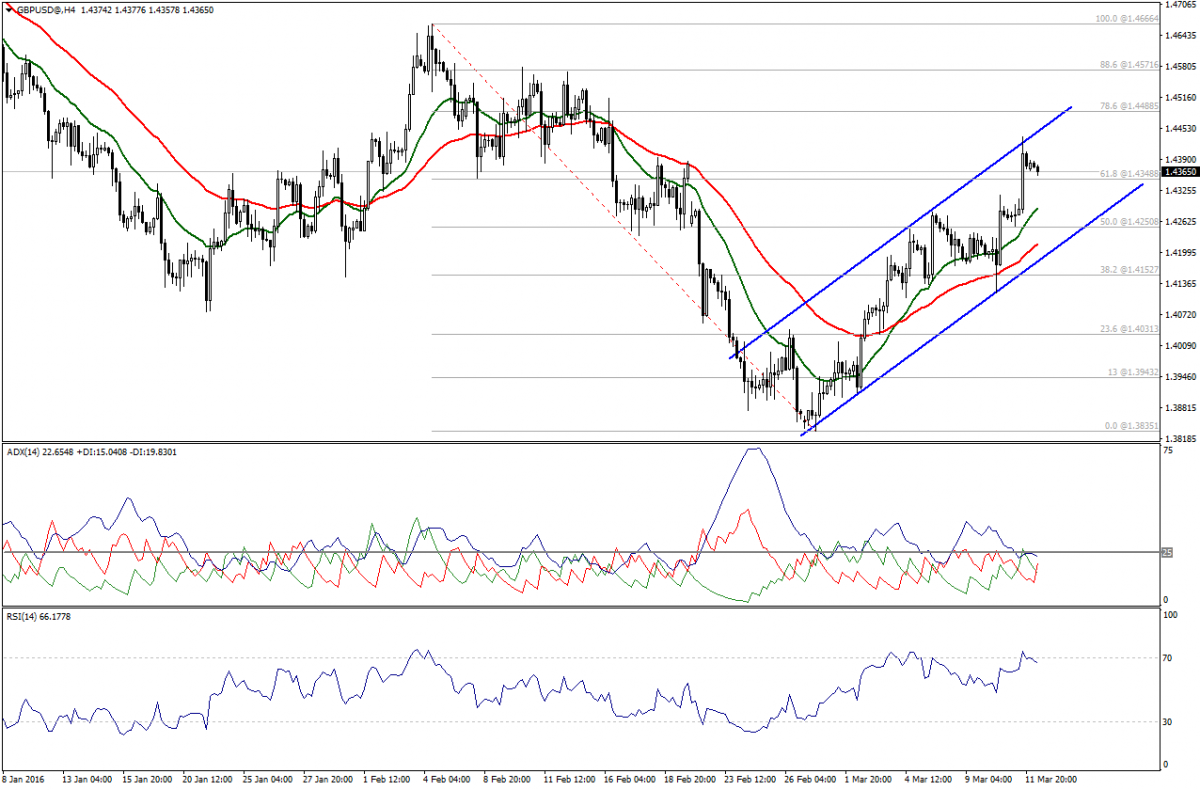
GBP/USD has been trading within a narrow range since the opening of the week following the strong upside actions seen last week, while prices are stable above 61.8% Fibonacci at 1.4345.

However, some bearish signs appeared on ADX and RSI, but that contradicts with the negativity on moving averages and stability above 61.8%. Hence, we will be neutral over intraday basis.
Support: 1.4345 – 1.4300 – 1.4250
Resistance: 1.4410 – 1.4490 – 1.4570
Direction: Neutral
