Zynga Inc. (ZNGA), formerly Presidio Media LLC, is a social game developer with 232 million average monthly active users (MAUs) in 166 countries. The Company’s games are accessible on Facebook, other social networks and mobile platforms to players globally, wherever and whenever they want.
ZNGA stock just came up on a real-time custom scan. This one hunts for calendar spreads between the front two months.
Custom Scan Details
Stock Price GTE $5
Sigma1 - Sigma2 GTE 8
Average Option Volume GTE 1,000
Industry isNot Bio-tech
Days After Earnings GTE 5 LTE 70
Sigma1, Sigma2 GTE 1
The goal with this scan is to identify back months that are cheaper than the front by at least 8 vol points. I'm also looking for a reasonable amount of liquidity in the options (thus the minimum average option volume), want to avoid bio-techs (and their crazy vol) and make sure I'm not selling elevated front month vol simply because earnings are approaching.
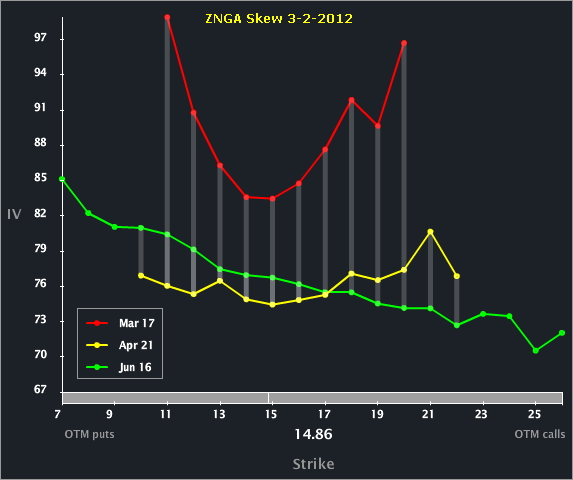
Let's start with the Skew Tab to visualize the calendar vol diff.

We can see the vol diff that has opened up between the front and the two back months. The front expiry also exhibits a parabolic skew -- both the upside and downside OTM options are more expensive than the ATM reflecting "evenly likely" two-tailed risk.
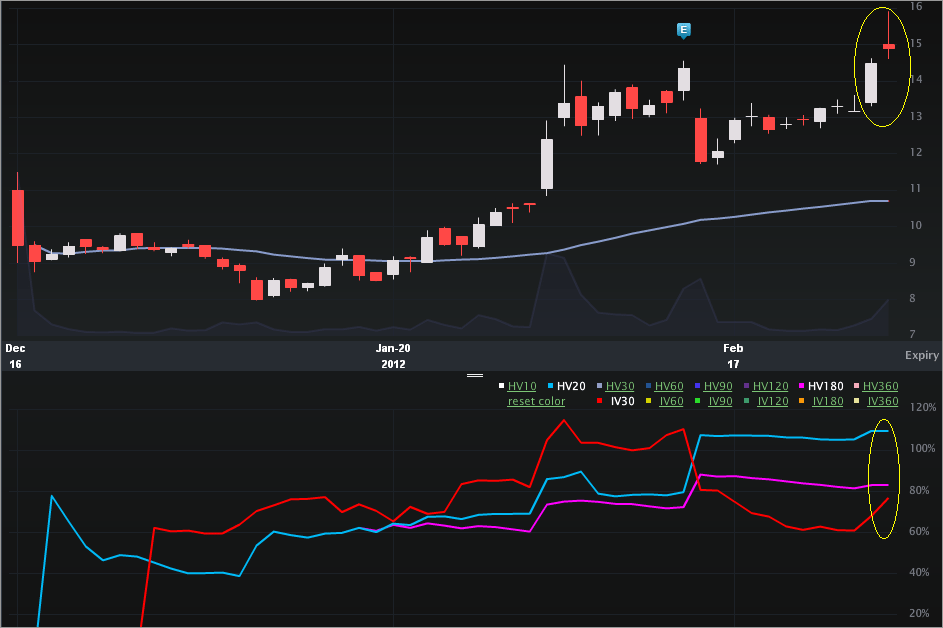
Now we can turn to the Charts Tab (below). The top portion is the stock price, the bottom is the vol (IV30™ - red vs HV20 - blue vs HV180 - pink).

ZNGA underlying has breached a new all-time high (should it close here). At the same time, the implied was falling... until today where it has popped. The vol comps are:
IV30™: 76.93%
HV20™: 109.41%
HV180™: 83.04%
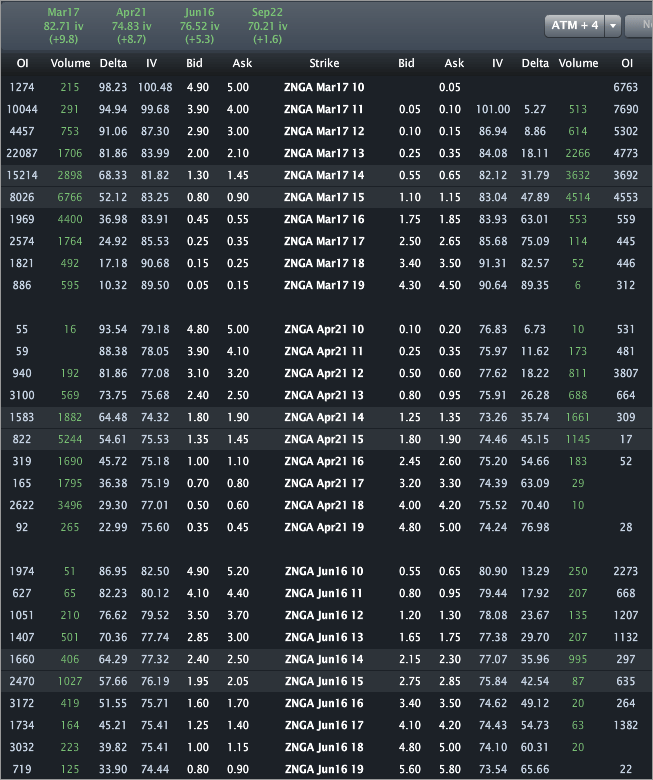
Finally, let's look to the Options Tab (below).

We can see the vol diff from Mar to Apr is about 8 vol points.
This is trade analysis, not a recommendation.
ZNGA stock just came up on a real-time custom scan. This one hunts for calendar spreads between the front two months.
Custom Scan Details
Stock Price GTE $5
Sigma1 - Sigma2 GTE 8
Average Option Volume GTE 1,000
Industry isNot Bio-tech
Days After Earnings GTE 5 LTE 70
Sigma1, Sigma2 GTE 1
The goal with this scan is to identify back months that are cheaper than the front by at least 8 vol points. I'm also looking for a reasonable amount of liquidity in the options (thus the minimum average option volume), want to avoid bio-techs (and their crazy vol) and make sure I'm not selling elevated front month vol simply because earnings are approaching.
Let's start with the Skew Tab to visualize the calendar vol diff.

We can see the vol diff that has opened up between the front and the two back months. The front expiry also exhibits a parabolic skew -- both the upside and downside OTM options are more expensive than the ATM reflecting "evenly likely" two-tailed risk.
Now we can turn to the Charts Tab (below). The top portion is the stock price, the bottom is the vol (IV30™ - red vs HV20 - blue vs HV180 - pink).

ZNGA underlying has breached a new all-time high (should it close here). At the same time, the implied was falling... until today where it has popped. The vol comps are:
IV30™: 76.93%
HV20™: 109.41%
HV180™: 83.04%
Finally, let's look to the Options Tab (below).

We can see the vol diff from Mar to Apr is about 8 vol points.
This is trade analysis, not a recommendation.
