Most days this early morning post is reserved for a macro event in the markets, but today I thought we could shake things up a bit. With the mostly sideways movements of the broad market, or if you prefer channels, the longer term story has not really changes much in a while.
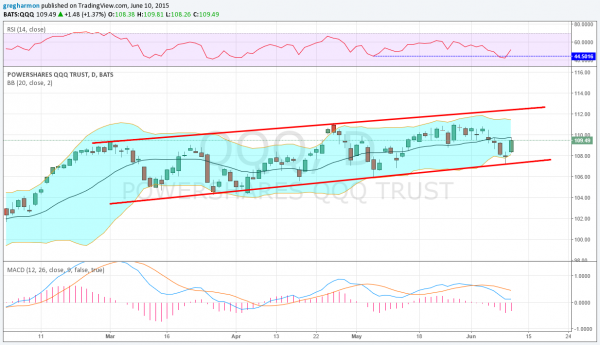
But if you focus the microscope in to a smaller zone there are some interesting things going on. The current chart in the PowerShares QQQ Trust Series 1 (NASDAQ:QQQ) offers a couple of them. The chart below shows the recent channel for the QQQ ETF. It offers four interesting perspectives on a short term move higher.

The first comes from Japanese candlestick principles. The candle for Tuesday June 9th (2nd to last one) is what is called a doji. It represents indecision. This is because you can see in the candlestick that it opened at one price, fell from that to the low level of the day and then recovered. The recovery turned into a gain on the day that was then sold off to end the day nearly unchanged.
No clear winners between sellers and buyers, so indecision. This often marks an important place with that balance between buyers and sellers playing out. It can resolve in either direction but whichever it does is a signal for a possible trend. In this case it resolved to the upside, buyers more powerful than sellers. This is a buy signal for a trend higher.
The second is the touch of the price to the lower Bollinger Band® and then a reversal higher. You can see just in this channel that the lower Bollinger Band has acted as support 3 times previously, and if this one holds up it is the fourth time. The subsequent movement in price has then been at least over the mid line of the Bollinger Bands and the last two times near or over the top Bollinger Band. Another short term positive.
Next, comes from the channel itself. There is no rhyme or reason as to why the channel is there other than that the price action has allowed it to be drawn by each reversal. But observing this pattern a touch and reversal at the lower end of the channel has moved higher to at least 75% of the way towards the top of the channel. No guarantees it will happen again, but another check mark in the upside column.
Finally there is what is known as a Positive RSI Reversal. The RSI is a momentum indicator running from oversold to overbought. You can see as price falls it generally falls and it may turn, leading, on a price reversal. A Positive RSI Reversal occurs when the level of the RSI makes a new low like it did 2 days ago relative to the bottom in May, while the price does not make a new low.
So momentum exhausted at a lower level and reversed but price was not as weak. You could say a bit of relative strength over time. This pattern targets a move back higher in price equal to the prior leg higher. This would target about 112.25 on the QQQ.
This type of mosaic of multiple types of technical analysis all pointing in the same direction is something to pay particular attention to, and something I look for. In practical terms it means that many types of traders will all be looking to trade the same way. Alignment.
The information in this blog post represents my own opinions and does not contain a recommendation for any particular security or investment. I or my affiliates may hold positions or other interests in securities mentioned in the Blog, please see my Disclaimer page for my full disclaimer.
