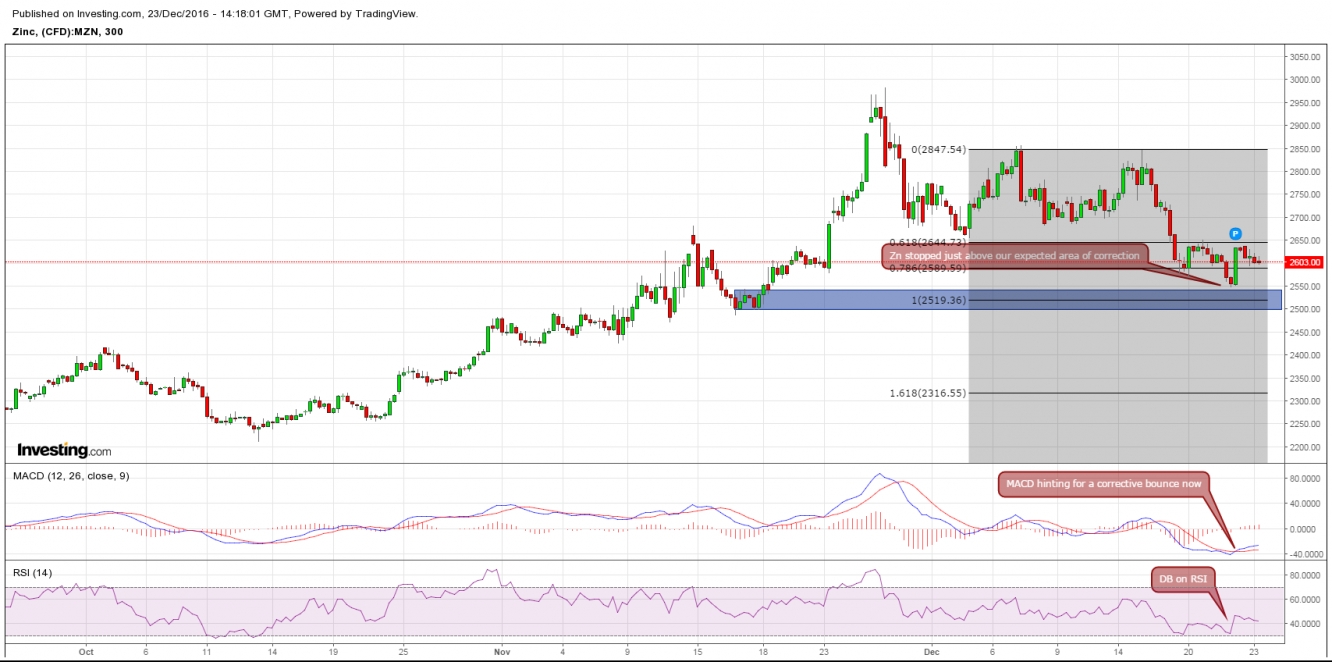
Here is what I said about zinc on 24th December, 2016. The chart from that day is reproduced below:
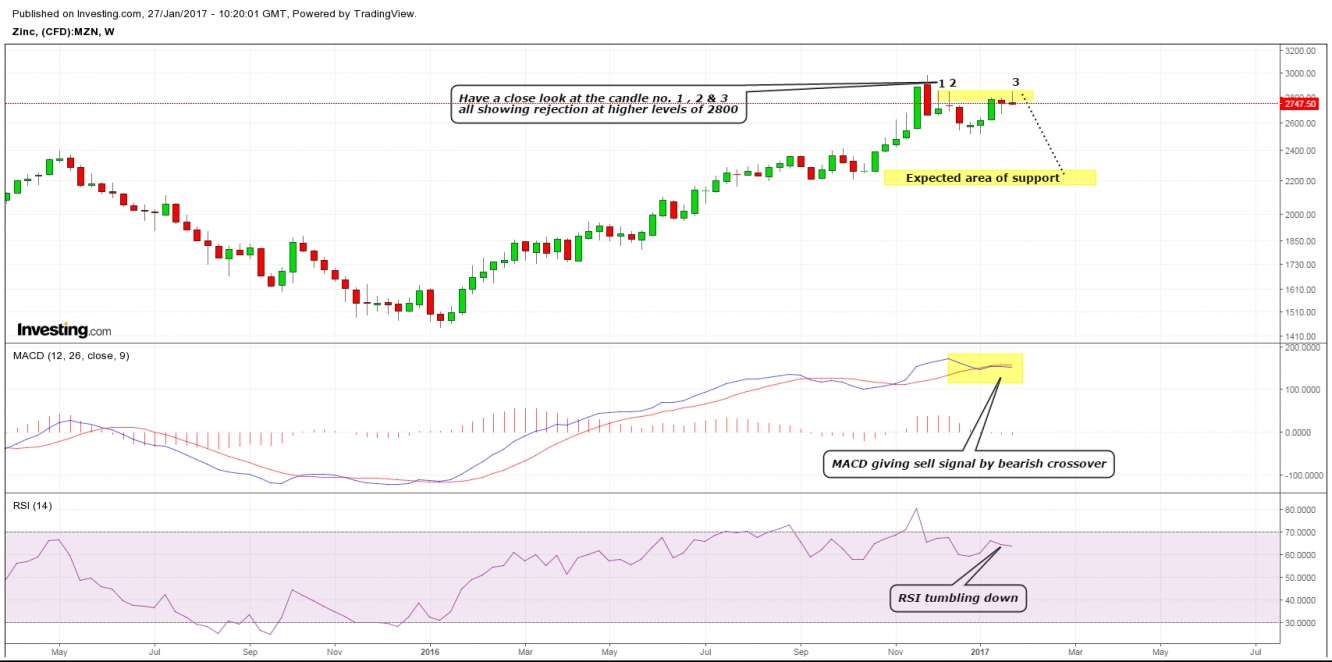
Here is the weekly chart below:

On a closure, look at the weekly candles as it is clear that the prices are failing to hold the ground above 2850 levels and coming down from the same level. MACD is in favour of bears and RSI also tumbling down, it seems that zinc is going under complex correction. Let's have a look at the daily chart for further insight into the strucure.
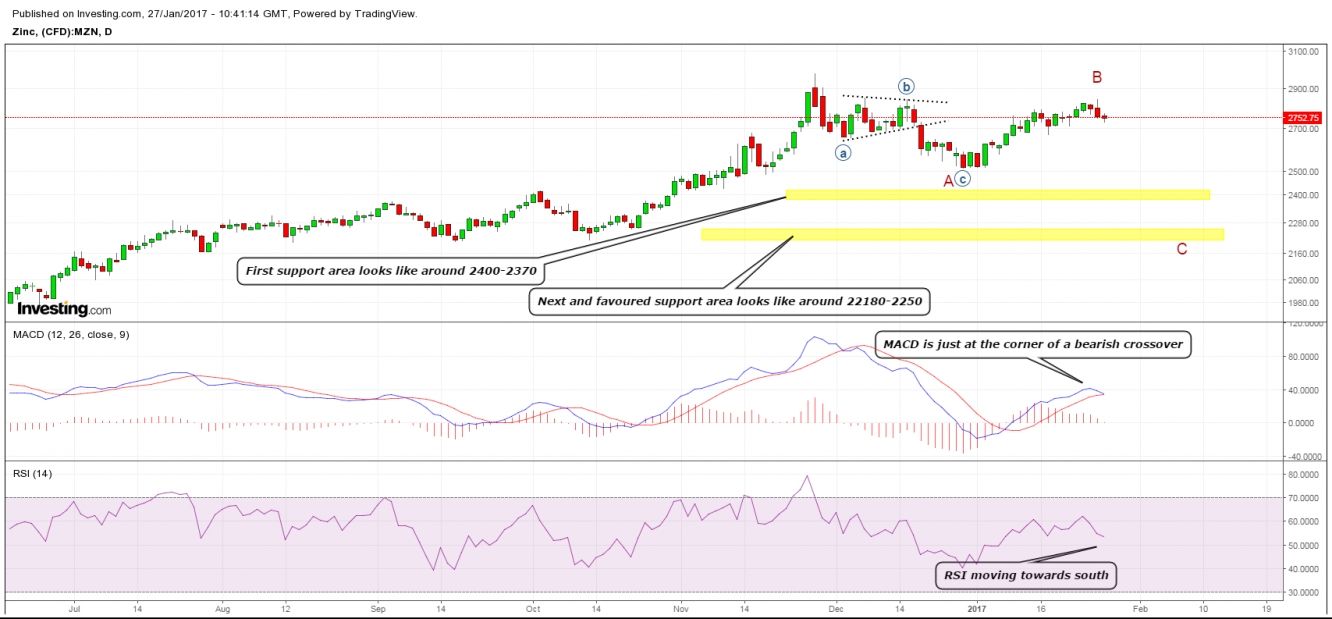
MACD is just at the corner of bearish crossover, RSI is moving away from the previous high and another rejection at 2850, all these factors are a type of warning for bulls. Odds favor a correction here to get support at lower levels before resuming higher. Let's have another look at the lower timeframe.
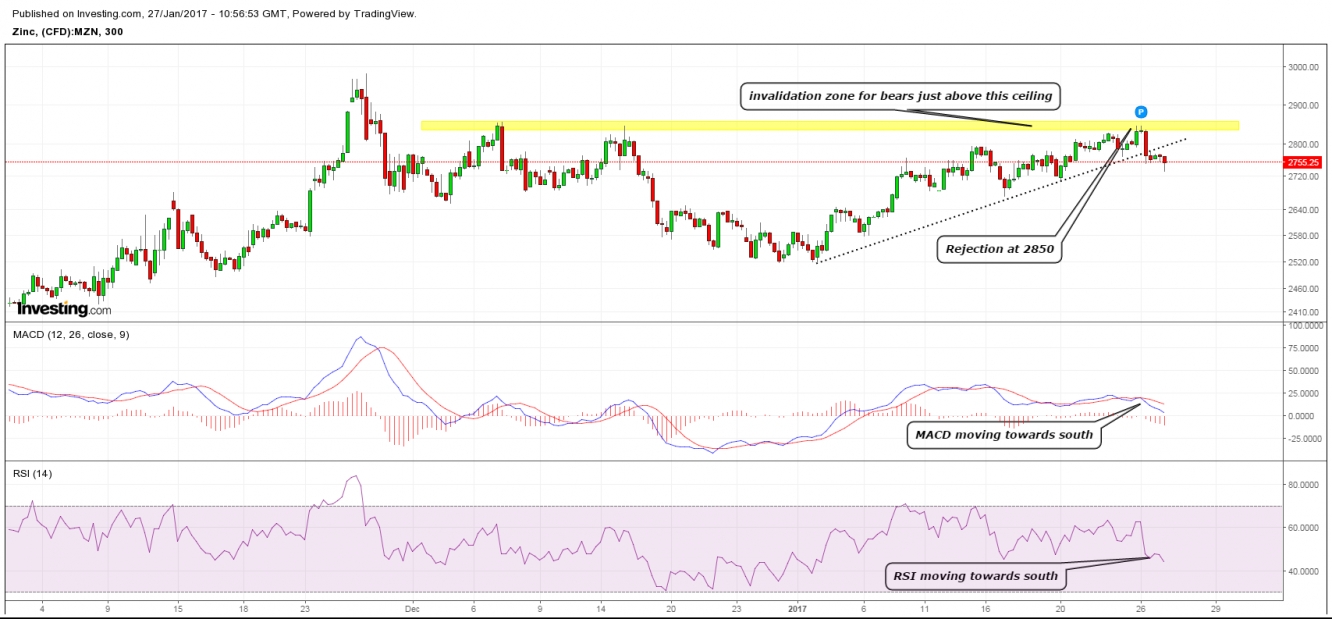
Both the indicators are in favour of bears. Any type of reversal is only after the decisive break of 2850-2860 area. Above 2850 it might zoom towards 3400 zone so tight stops are required. I am with bears as far as it trades below 2850-2860 area.
Resistance: 2800/2860
Support: 2680/2640

