
Zillow Group (NASDAQ:ZG) reported earnings of 4 cents per share in the second quarter of 2017, which was much better than a loss of 71 cents reported in the year-ago quarter.
Including stock-based compensation, the company incurred loss of 12 cents, which was narrower than the Zacks Consensus Estimate of a loss of 15 cents.
Total revenue increased 28% year over year to $266.9 million, beating the Zacks Consensus Estimate of $265 million.
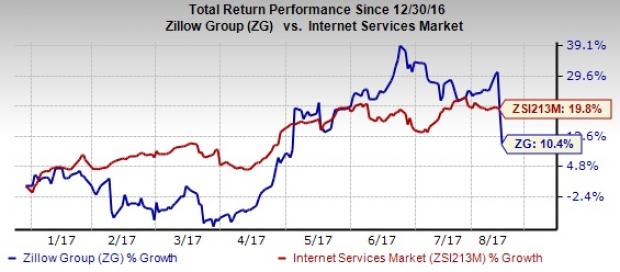
Notably, shares of Zillow have gained 10.4% year to date, underperforming the industry’s 19.8% rally.
Quarter in Details
Zillow has two reportable segments namely, Marketplace (which includes Premier Agent, other real estate and mortgages) and Display.
In the second quarter, Marketplace revenues of $248.6 million increased 30% on a year-over- year basis. Premier Agent increased 29% year on year attributable to increase in platform visits. The rise was primarily driven by an increase in the number of agents and accelerated spending for advertising.
Real Estate revenues surged 45% year over year. This segment was propelled by continued demand for the company’s brands such as StreetEasy, Zillow, Trulia, Naked Apartments, Hot Pads and HREO.
Zillow Group, Inc. Price, Consensus and EPS Surprise
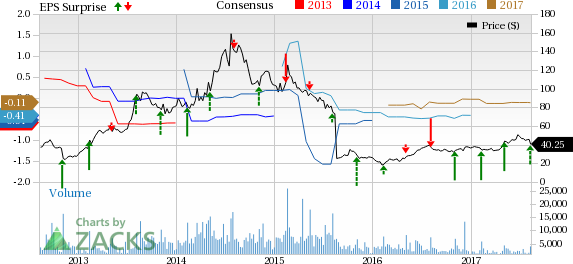
Zillow Group, Inc. Price, Consensus and EPS Surprise | Zillow Group, Inc. Quote
Mortgages reached $20.9 million, reflecting a 14% year-over-year increase. Since the majority of the consumers are home purchase loan shoppers, fluctuation in interest rates did not affect them massively.
On the other hand, Display revenues of $18.3 million increased approximately 9% on a year-over-year basis, with better-than-expected brand sales initiatives and resultant increased traffic being the key driving factors.
Reported sales and marketing expenses as a percentage of revenues expanded 140 basis points (bps). Technology and development expenses as a percentage of revenues however contracted 100 bps.
As of Jun 30, 2017, Zillow had cash and cash equivalents of $276.5 million compared with $243.6 million as of Dec 31, 2016.
Guidance
Management expects third-quarter 2017 total revenue to remain in the range of $273 million to $278 million. The Zacks Consensus Estimate is pegged at $235.9 million.
The company expects Premier Agent revenues of $196 million to $198 million, other real estate revenues of $40 million to $41 million, and mortgage revenues of $20 million to $21 million, which taken together comprise Marketplace revenues.
Display revenues are projected in the range of $17 million to $18 million.
Operating expenses are expected to remain in the range of $261 million to $266 million. Net loss is expected in the range of $2.25 million to $7.25 million.
For full year 2017, management raised its guidance. Revenues are now anticipated to be in the range of $1.055 billion to $1.065 billion, representing 25% year-over-year growth at the midpoint. The EBITDA outlook ranges between $220 million and $230 million, with a 21% margin at the midpoint.
Our Take
Zillow posted better than expected top- and bottom-line results. The company’s increased advertising effectiveness, continuous product innovation and effective free marketing channels are helping it to gain audience. Continuous growth in new MLS partnerships is enabling the company to deliver high quality listing information to homebuyers and sellers.
However, increasing competition, hiked mortgage interest rates and constrained advertising spend remain headwinds.
Zacks Rank and Stocks to Consider
Currently, Zillow has Zacks Rank #3 (Hold).
Better-ranked stocks in the broader technology sector include Lam Research Corporation (NASDAQ:LRCX) and Activision Blizzard, Inc (NASDAQ:ATVI) both sporting a Zacks Rank #1 (Strong Buy) and Alibaba Group (NYSE:BABA) , with a Zacks Rank #2. You can see the complete list of today’s Zacks #1 Rank stocks here.
Long-term earnings growth rate for Lam Research, Activision Blizzard and Alibaba Group is projected at 17.2%, 13.63% and 28.97% respectively.
Will You Make a Fortune on the Shift to Electric Cars?
Here's another stock idea to consider. Much like petroleum 150 years ago, lithium power may soon shake the world, creating millionaires and reshaping geo-politics. Soon electric vehicles (EVs) may be cheaper than gas guzzlers. Some are already reaching 265 miles on a single charge.
With battery prices plummeting and charging stations set to multiply, one company stands out as the #1 stock to buy according to Zacks research.
It's not the one you think.
Alibaba Group Holding Limited (BABA): Free Stock Analysis Report
Zillow Group, Inc. (ZG): Free Stock Analysis Report
Activision Blizzard, Inc (ATVI): Free Stock Analysis Report
Lam Research Corporation (LRCX): Free Stock Analysis Report
Original post