
On Apr 24, 2019, the price of Zcash (ZEC) reached an hourly high of $67.67 and €60.29 A sharp decrease ensued and the price made lows close to $60 and €52 on Apr 26.
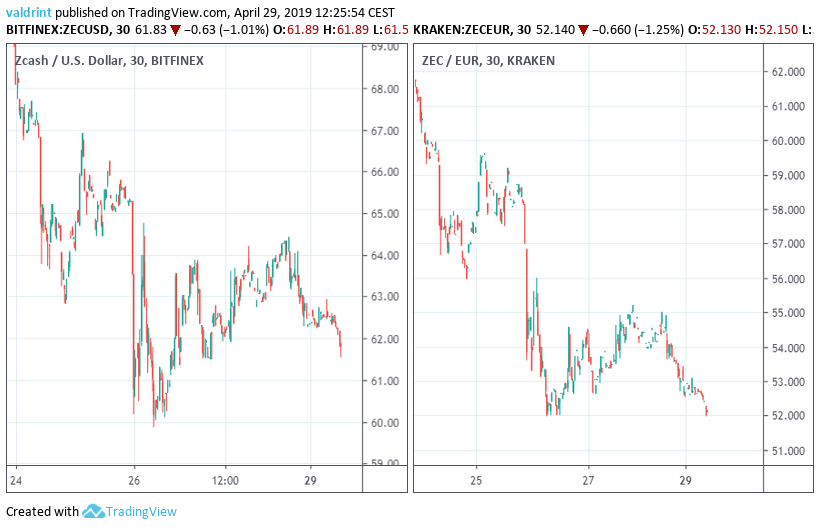
ZEC/USD and ZEC/EUR Prices: Apr 24 – 29
Will price losses continue for Zcash or can we expect a reversal soon?
Let’s find out!
Zcash (ZEC): Trends and Highlights for Apr 29, 2019
- ZEC/USD and ZEC/EUR have been on a gradual downtrend since Apr 24
- It broke down from a symmetrical triangle on Apr 28 and is trading inside a long-term descending wedge.
- The moving averages have made a bearish cross.
- There is resistance near $63 and €56.
Current Trading Pattern
We analyze the price of ZEC/USD on Binance at 30-minute intervals from Apr 24 to Apr 29 in order to trace the current trading pattern. We do not include euros in this section because only one trading pair is needed to generate the current trading pattern. Both ZEC/USD and ZEC/EUR are discussed in the final two sections.
The price made a high of $67.67 on Apr 24. A gradual downward move began. Several market cycles have been completed since and the price has reached lower highs each time.
Tracing these lows gives us a descending resistance line:
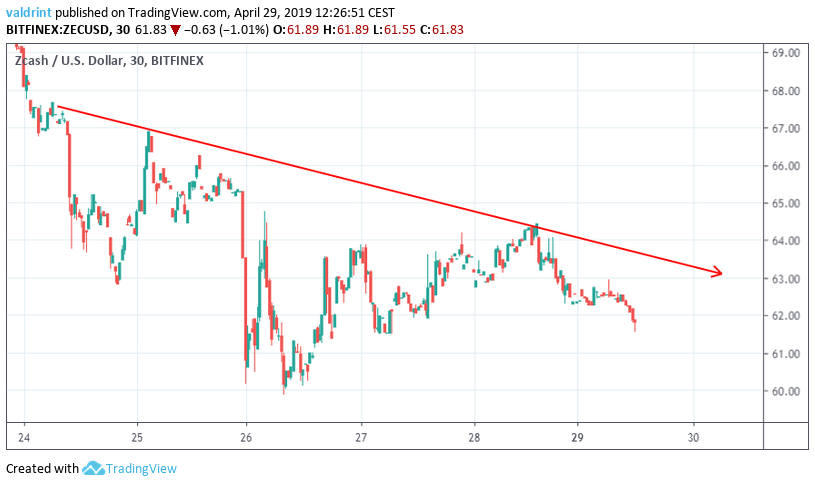
On Apr 26, the price reached a low of $60.75. A gradual upward move began. The price made several higher lows. Tracing these lows gives us an ascending support line.
The resistance and support lines combine to create a symmetrical triangle:
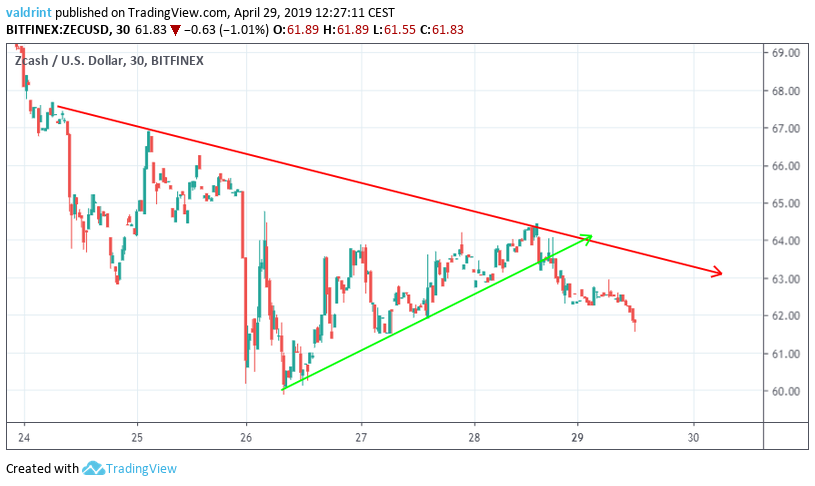
The price broke down from this triangle on Apr 28 and has been decreasing since.
To assess whether or not this decrease will continue, we need to take a look at some technical indicators in a longer time-frame.
What Do the Technical Indicators Say?
In this section, the price of ZEC/USD is analyzed at one-day intervals from Apr 1 to Apr 29 alongside the 10- and 20-day moving averages (MA).
Moving averages are tools used in technical analysis to smooth out price action. It is a lagging indicator since it is based on past prices. The relationship between price and moving averages can help in identifying resistance and support areas.
During the month of April, Zcash has also been trading within a descending channel. The triangle traced above is a short-term trading pattern that was occurring within this longer formation.
10- and 20-day MAs are traced alongside April’s descending channel below. The triangle within the channel using dashed lines.
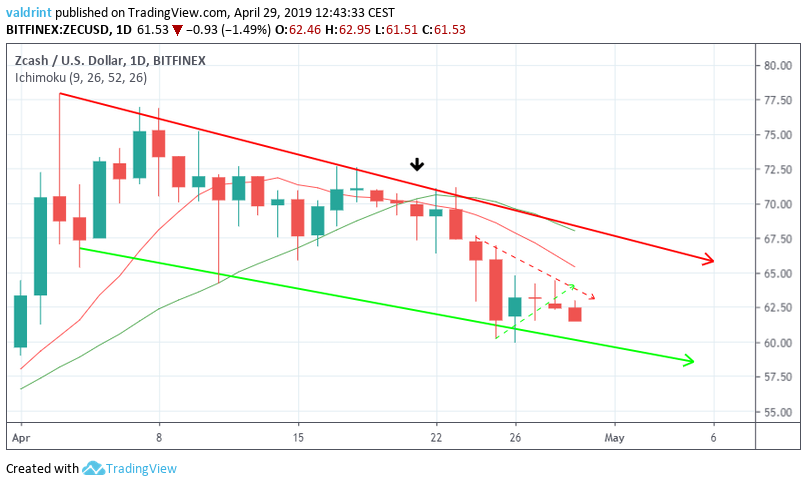
On Apr 21, the 10-day MA crossed below the 20-day MA. This is known as a bearish cross and often indicates that the price has begun a downtrend.
The use of this indicator suggests that the price will continue to decrease at the rate predicted by the channel. However, the proximity of the price to the support line suggest that price might rise toward the resistance line in the short-term.
In this event, we may see short-term gains despite longer-term losses.
Finding Resistance
To determine possible future price levels given a short-term rise toward the resistance line, we incorporate resistance areas into the analysis.
Resistance areas are created when the price reaches the same level several times. They can provide likely reversal areas in case a breakdown occurs.
One possible resistance area is shown for both ZEC/USD and ZEC/EUR below:
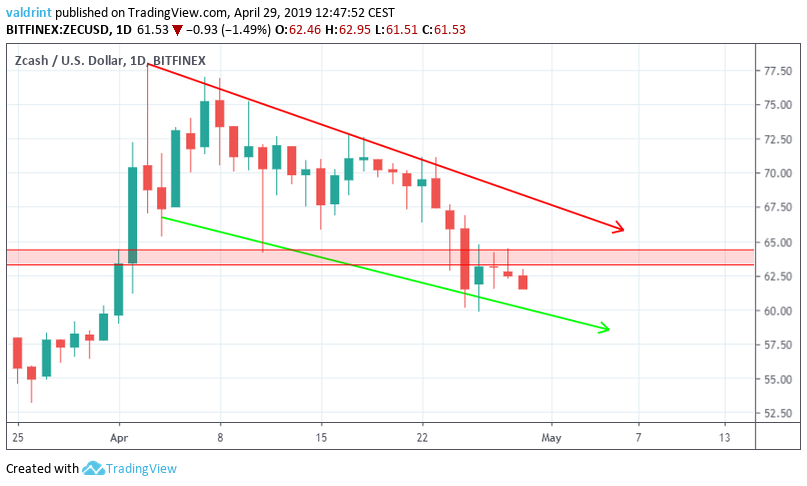 ZEC/USD
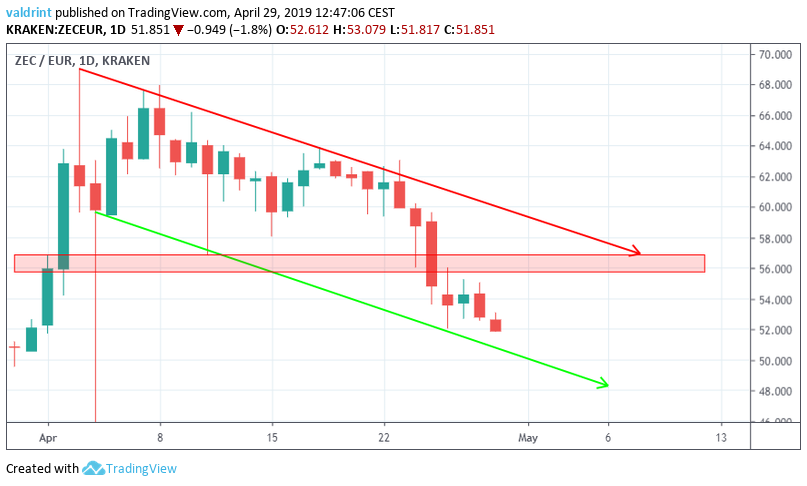 ZEC/EUR
The closest resistance area is found near $63 and €55. This resistance is located within the current monthly trading pattern. It is possible that the price might rise to reach this area before future losses.
It is also possible that the price will push past the resistance area and touch the resistance line. We do not believe the price will increase beyond this point. A breakout seems unlikely.
Summary of Analysis
Based on this analysis, the price will likely keep decreasing at the rate predicted by the channel. If the price begins a reversal, it is likely to find resistance at $63 and €56. If these levels are reached, we predict that prices will fall soon thereafter.
Disclaimer: This article is not trading advice and should not be construed as such. Always consult a trained financial professional before investing in cryptocurrencies, as the market is particularly volatile.