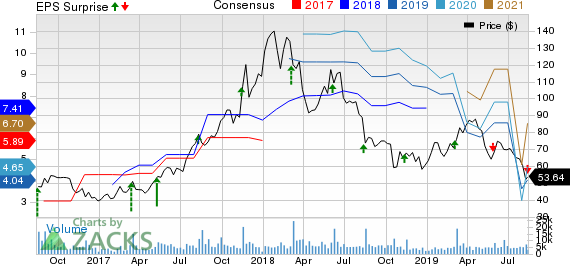
YY Inc. (NASDAQ:YY) delivered second-quarter 2019 non-GAAP earnings of 75 cents per American depositary shares (ADS), which missed the Zacks Consensus Estimate of 92 cents and declined significantly from the year-ago reported figure of $2.03.
Revenues totaled $917 million, surpassing the Zacks Consensus Estimate of $881.45 million.
In domestic currency, non-GAAP earnings per ADS declined 62.6% to RMB5.4 while revenues of RMB 6.3 billion rose 66.8%.
Top-Line Details
The top-line growth can primarily be attributed to strong live streaming revenues, which increased 66.4% year over year to RMB5.92 billion, accounting for 94.1% of total net revenues in the reported quarter.
Notably, other revenues increased 74.4% to RMB372.5.5 million, primarily driven by robust growth in advertising revenues from HUYA and BIGO.
The stellar performance of YY Live and HUYA Live also contributed to the impressive top-line growth. YY and HUYA Live contributed 48.3% and 32.4%, respectively to total live streaming revenues in the second quarter. Further, year-over-year growth at YY Live and HUYA Live was 11.5% and 93.7%, respectively.
Additionally, average mobile live streaming monthly active users (MAUs) increased 39.2% year over year globally to 140.9 million wherein YY contributed 38.9 million, up 3.7% year over year. HUYA contributed 55.9 million, which increased by 31.1% year over year. Also, BIGO Live contributed 20.8 million, which increased 6.6% year over year. Notably, contribution from Hago came in at 25.3 million during the quarter.
IMO had almost 212 million MAUs in the reported quarter. Notably, Likee short-form video content services reported 17.5 million MAUs in 40 countries and regions across South Asia, Central Asia and Europe on the IMO platform.
Moreover, the total number of paying users of YY increased 19.1% to 4.2 million year over year. Total number of paying users of HUYA increased 46.7% year over year to 4.9 million.
Total cost of revenues increased 80.4% year over year to RMB4.17 billion in the reported quarter.
Cost of revenues for YY Live and HUYA increased 12.9% and 92.1% year over year to RMB1.63 billion and RMB1.67 billion, respectively. This was due to rise in revenue sharing fees and content costs.
However, the increase in revenue sharing fees and content costs paid to performers and content providers was in line with the increase in live streaming revenues for both YY Live and Huya segments. Notably, revenue sharing fees and content costs increased to RMB3.15 billion in second-quarter 2019 from RMB1.88 billion reported in the year-ago quarter.
Moreover, bandwidth costs in the reported quarter were RMB423.8 million compared with RMB246 million in year-ago reported quarter. The increase was due to expansion of the overseas user base, primarily due to the consolidation of BIGO.
Operating Details
Gross profit climbed 45.4% from the year-ago quarter to RMB2.12 billion. However, gross margin contracted 500 basis points (bps) to 33.7% in the second quarter, primarily due to higher revenue-sharing fees and content costs. The decrease was also attributed to low gross margin of HUYA and BIGO.
Operating expenses totaled RMB2.09 billion, up 168.2% from the year-ago quarter. This was due to the company’s increased investment in sales & marketing initiatives in domestic and global markets.
Research & development (R&D), sales & marketing (S&M) and general & administrative (G&A) expenses grew 121.5%, 346.7%, and 41.4% year over year respectively. As a percentage of revenues, R&D expanded 260 bps while G&A expenses contracted 100 bps year over year. However, S&M expenses, as a percentage of revenues, increased exponentially to 17.5% from 6.5% in the year-ago quarter.
Non-GAAP operating income declined 43.7% year over year to RMB524.9 million. As a percentage of revenues, non-GAAP operating margin declined to 8.3% from 24.7% in the year-ago quarter primarily due to the consolidation of Bigo and other overseas expansion initiatives.
Balance Sheet & Cash Flow
As of Jun 30, 2019, YY had cash and cash equivalents of about RMB11.01 billion compared with RMB8.94 billion in the previous quarter.
Net cash from operating activities amounted to RMB1.13 billion compared with RMB966.1 million in the previous quarter.
Q3 Guidance
YY expects net revenues to be between RMB6.57-RMB6.77 billion, indicating year-over-year growth of 60.2%-65.1%.
The company is planning to strengthen its global footprint and add a variety of content to its live streaming platform in 2019.
Zacks Rank & Stocks to Consider
Currently, YY carries a Zacks Rank #5 (Strong Sell).
Some better-ranked stocks in the broader technology sector include Anixter International (NYSE:AXE) , Radware Ltd (NASDAQ:RDWR) and Chegg (NYSE:CHGG) . All the three stocks sport a Zacks Rank #1 (Strong Buy). You can see the complete list of today’s Zacks #1 Rank stocks here.
Long-term earnings growth rate for Anixter, Radware and Chegg is currently pegged at 8%, 18%, and 30%, respectively.
Looking for Stocks with Skyrocketing Upside?
Zacks has just released a Special Report on the booming investment opportunities of legal marijuana.
Ignited by new referendums and legislation, this industry is expected to blast from an already robust $6.7 billion to $20.2 billion in 2021. Early investors stand to make a killing, but you have to be ready to act and know just where to look.
See the pot trades we're targeting>>
YY Inc. (YY): Free Stock Analysis Report
Chegg, Inc. (CHGG): Free Stock Analysis Report
Radware Ltd. (RDWR): Free Stock Analysis Report
Anixter International Inc. (AXE): Free Stock Analysis Report
Original post
Zacks Investment Research

