
Yum! Brands, Inc. (NYSE:YUM) has delivered lower-than-expected results in the fourth quarter of 2018.
Adjusted earnings of 40 cents per share missed the Zacks Consensus Estimate of 97 cents by 58.8%. Further, the bottom line decreased 58.3% on a year-over-year basis. While the shift to refranchising substantially helped the company’s operating margin, pre-tax investment expenses negatively affected earnings in the quarter under review.
Total revenues of $1,558 million were down 1.2% year over year and also lagged the consensus estimate of $1,587 million. The downside was caused by decreased sales, owing to the company’s continued refranchising initiatives.
Worldwide system sales, excluding foreign currency translation, grew 6%, with Taco Bell at 9%, KFC at 7% and Pizza Hut at 2% in the quarter under review. Also, the company opened 865 net new units and added 1,282 Telepizza units, reflecting 7% net new unit growth. Moreover, Yum! Brands refranchised 331 restaurants, including 227 KFC and 104 Taco Bell units for pre-tax proceeds of $380 million. At the end of the quarter under review, the company’s global franchise ownership mix increased to 98%.
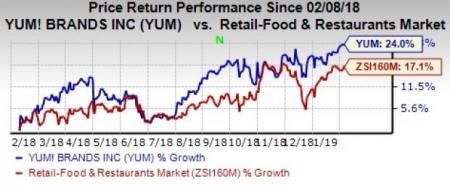
Notably, shares of Yum! Brands have gained 24% in the past year, outperforming the industry’s rally of 17.1%.
Segmental Performance
Yum! Brands reports under three segments — KFC, Pizza Hut and Taco Bell.
Revenues from KFC totaled $686 million, down 16% on a year-over-year basis. Comps at this division increased 3%, same as the year-ago quarter’s and third quarter’s increase.
This segment’s operating margin was up 3.8% to 37.2% year over year, owing to refranchising and same-store sales growth, partially offset by lower advertising and other franchise service revenues.
At Pizza Hut, revenues amounted to $275 million, up 18% on a year-over-year basis. Comps remained flat compared with the year-ago quarter’s increase of 1% and the third quarter’s decline of 1%.
The segment’s operating margin was down 5.7% year over year to 33.1% due to the gross up of advertising and other franchise service revenues, partially offset by refranchising.
Taco Bell’s revenues were $597 million, up 12% from the year-ago quarter. Comps rose 6%, which compared favorably with the year-ago quarter’s growth of 2%. In third-quarter 2018, the segment’s comps gained 5%.
Segment’s operating margin was down 170 basis points to 31.9% year over year.
Other Financial details
Cash and cash equivalents as of Dec 31, 2018, totaled $292 million compared with $1,522 million as of Dec 31, 2017. Long-term debt at the end of the reported quarter was $9,751 million compared with $9,429 million at the end of 2017. During the quarter, the company repurchased 7.8 million shares for $696 million.
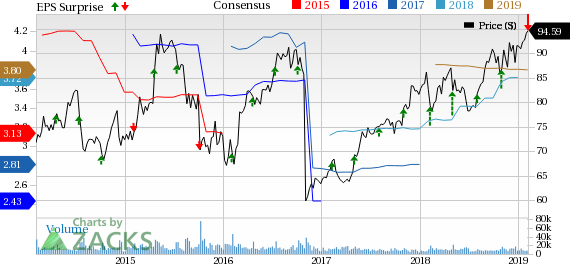
Yum! Brands, Inc. Price, Consensus and EPS Surprise
2018 Results
For 2018, worldwide system sales, excluding foreign currency translation, grew 5%. This is because of a worldwide system sales growth of 6% at KFC and Taco Bell each, and 1% growth for the same at Pizza Hut.
The company opened 1,757 net new units in 2018 and added 1,282 Telepizza, reflecting 7% year-over-year net unit growth. Yum! Brands refranchised 660 restaurants — including 364 KFC, 97 Pizza Hut and 199 Taco Bell units — for pre-tax proceeds of $825 million, recording net refranchising gains of $540 million.
For 2018, the company repurchased 28.2 million shares, totaling $2.4 billion at an average price of $85.
Zacks Rank & Peer Releases
Yum! Brands currently carries a Zacks Rank #3 (Hold). You can see the complete list of today’s Zacks #1 Rank (Strong Buy) stocks here.
Brinker (NYSE:EAT) reported mixed second-quarter fiscal 2019 results, wherein earnings were in line with the Zacks Consensus Estimate but revenues surpassed the same. Adjusted earnings of 89 cents per share were in line with the Zacks Consensus Estimate and increased 2.3% on a year-over-year basis.
McDonald’s (NYSE:MCD) reported impressive fourth-quarter 2018 results. Adjusted earnings of $1.97 per share surpassed the consensus mark of $1.90 and increased 15% from the year-ago quarter (18% in constant currencies). The upside reflects stronger operating performance.
Starbucks (NASDAQ:SBUX) reported impressive first-quarter fiscal 2019 results. Adjusted earnings of 75 cents per share surpassed the Zacks Consensus Estimate of 65 cents and grew 15.4% on a year-over-year basis.
Zacks' Top 10 Stocks for 2019
In addition to the stocks discussed above, wouldn't you like to know about our 10 finest buy-and-holds for the year?
From more than 4,000 companies covered by the Zacks Rank, these 10 were picked by a process that consistently beats the market. Even during 2018 while the market dropped -5.2%, our Top 10s were up well into double-digits. And during bullish 2012 – 2017, they soared far above the market's +126.3%, reaching +181.9%.
This year, the portfolio features a player that thrives on volatility, an AI comer, and a dynamic tech company that helps doctors deliver better patient outcomes at lower costs.
McDonald's Corporation (MCD): Get Free Report
Yum! Brands, Inc. (YUM): Get Free Report
Brinker International, Inc. (EAT): Free Stock Analysis Report
Starbucks Corporation (SBUX): Get Free Report
Original post
Zacks Investment Research