It used to be a big deal, the kind of move that would itself move markets all over the world. Very quietly, the JPY has been trading higher over recent weeks and has reached a level of appreciation we haven’t seen since those rocky days in early September.
Only then, a rising yen (falling dollar) was a sign of bad things, an anti-reflation direction tied in with falling UST yields and greater bids on Eurodollar Futures. It was something of a daily trading rule coming out of Asian sessions; if JPY was up against the dollar, you could bet Treasuries were rallying (in price).
Obviously, we know what changed over the interim. China went in another direction, its currency almost literally. Now eurodollar futures flop as CNY rises, and UST yields move higher inversely to HKD. But is Japan completely out of it?
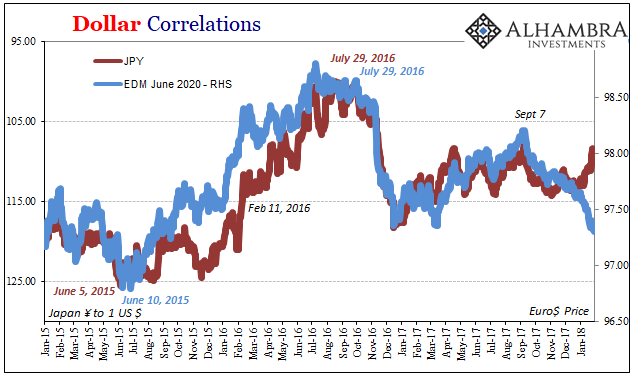
Another way of asking that question is, does JPY tell us anything important even if it’s not the marginal price setter right now? We can’t forget that even if China might be deriving marginal “dollar” flows from its hidden Hong Kong back channel, Japan isn’t outside of “dollars” entirely. Japanese banks are still a major part of the eurodollar system and especially its Asian “dollar” subset no matter how much, or little, European banks get pulled back in.
I look at JPY 108 with what I think is appropriate wariness, a fly in the otherwise booming ointment. This “wrong” yen is indicative, I believe, of the full measure of the curves.
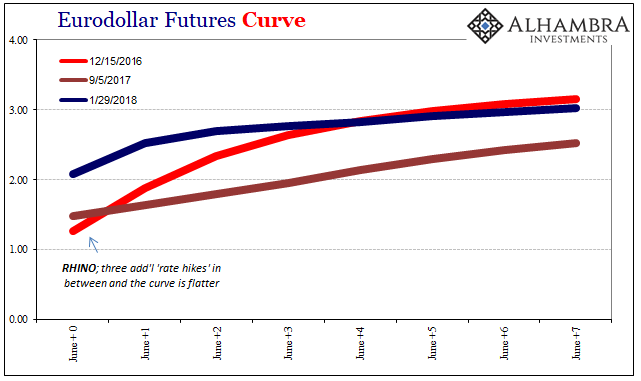
What I mean by that is pretty simple: despite all the noise and movement at the front end of whichever one, eurodollar futures pictured above and below, the back ends remain mostly steadfast. That isn’t to say that they aren’t moving there, only that what gets priced over time is a terminal level that is overall anathema to the more comprehensive idea of reflation.
You can see it more easily in comparison to past reflation peaks, including the one from December 2016:
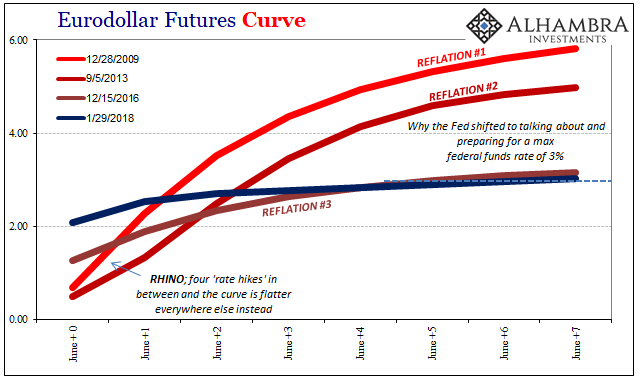
The eurodollar curve, as the Treasury curve flattening in its own way, is resisting anything more than a temporary change in monetary policy. That’s it. In other words, these markets are reflecting the possibility that the Fed may get to do a few more “rate hikes” than the market believed in the middle of last year.
This is what the falling dollar and certainly mainstream rhetoric has keyed on, the movement at the front, while maintaining denial about what’s (not) going on at the back. The back end, however, is far more important. It hasn’t really changed, meaning that the market expects the Fed still won’t get much farther than the same max 3%, which is a lot shallower in a terminal position than is currently appreciated.
There is a world of difference between a 3% ceiling and something like 5%. It’s the difference between 2011 and 2017 priced into almost everything – even things like commodity prices that otherwise appear to be really cooking in the right direction.
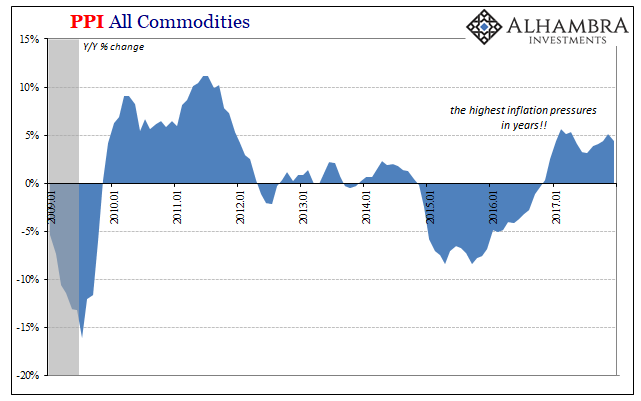
The PPI, for example, includes as a subcomponent an index representing all major commodity prices. Consistent with 2016’s “reflation,” it shifted conspicuously from a prolonged contraction to what seemed like a robust signal for producer level inflation; the kinds of cost pressures some economists, including those at the Fed, view as potentially inflationary and therefore worth heading off with monetary policy.
But that interpretation only stands if you pay too much attention to 2013-14 comparison (or the common narrative of “the highest in years”). Commodity prices, as I so often write, are up, but they aren’t really up. There is a big difference here, one that is better demonstrated by the overall index instead of the yearly change:
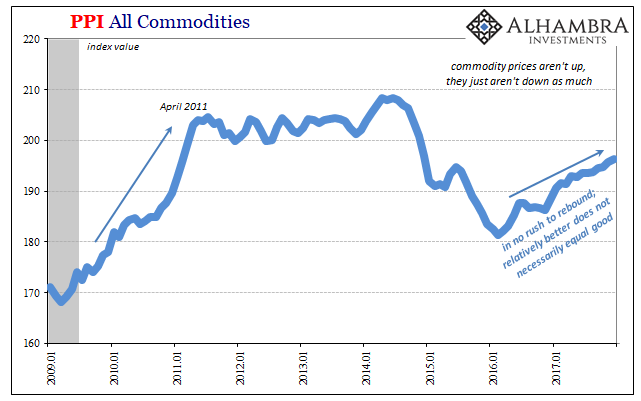
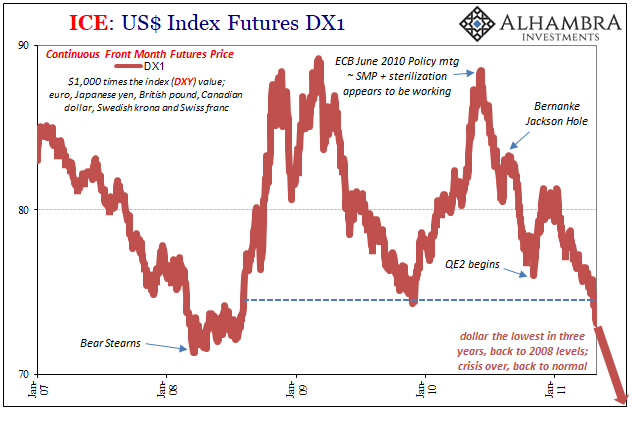
They are moving in the right direction, but in truth taking their time in doing so. Commodities are still down, just not as down as they were. The focus on the positive yearly change is misplaced, clearly demonstrated by the big difference in the slope over the past two years when compared with the robust rebound 2009-11.
The latter one was predicated on normalcy, represented in curves by a max 6% federal funds and the economic conditions that would have allowed it. The more meandering rise in producer prices over the last few years is at best that max 3% world, one more cautious and lacking of full opportunity.
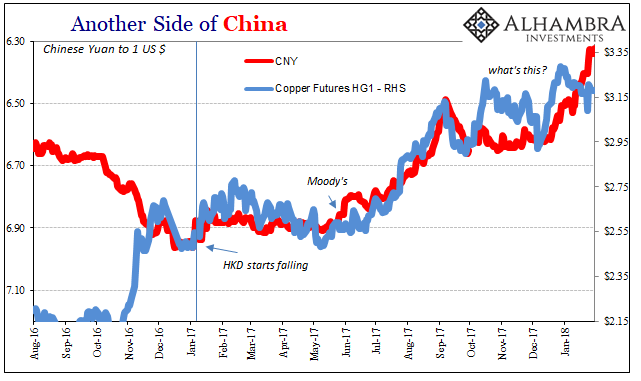
Another part of the problem, and one big reason why so much attention is focused on the front ends, is the difficulty in parsing what CNY suggests. On the surface, if CNY down = BAD was the operating correlation during the turbulent “rising dollar” period, CNY up must = GOOD seems a reasonable interpretation after its possible end. And it may be, but that’s not how it’s being described, nor all the other correlations forming from it. There are far more doubts about it than are given honest consideration, doubts expressed in max 3% as well as the lower slope of commodities in reflation.
Again, part of that is the misreading of everything at the front run through Federal Reserve policy. There are so many different mistakes in trying to filter these lackluster trends through the lens of “rate hikes.” It requires more than straight line extrapolation, more like a parabolic one. The idea that the economy is about to run into an inflationary boom only happens if commodities, as the economy, blasts through its current low-level upturn and transforms into a massive growth regime more like, if not bigger than, the one traded up to 2011.
While anything is possible, the rest of these markets (including curve back ends) continue to price that as a low probability scenario. This skepticism starts, I think, with CNY.
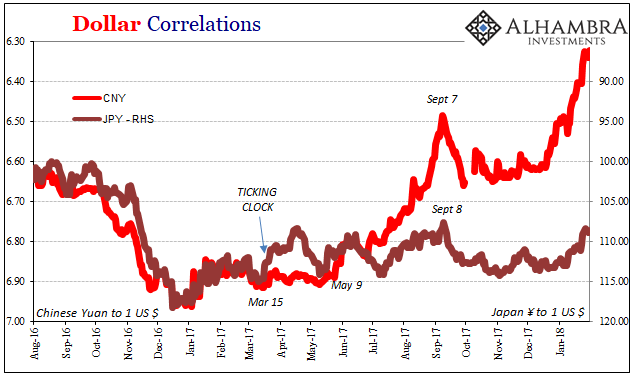
The basis for it isn’t just disbelief, it’s the downright weird way in which its being perpetrated. There is no fundamental basis for CNY up, with Chinese economic statistics (particularly forward-looking FAI) moving in the opposite direction (like JPY).
The net result is “falling dollar” “reflation” that is predicated mostly on a shifted correlation of dubious principle factors. It's been further amplified by the same fundamental misreading of commodities and curves being isolated outside of their comprehensive contexts, all in the same belief in Economic forecasting that any unbiased observer will note has been thoroughly discredited for years. The Fed wouldn’t be raising rates if things were about to get really good, right?
Except the very first “rate hike” was voted for December 2015 – right in the middle of a global downturn created by serious “dollar” illiquidity that policymakers thought impossible.
That’s ultimately what’s really going on here, at least from the standpoint of an overview of conditions (there are finer points to be made and debated). The eurodollar curve, for instance, is set up to respect what the Fed will do in the future closer at the front. Eurodollar futures prices are derived, after all, from LIBOR which is itself tied (more loosely now) to federal funds and therefore money alternatives like IOER and the RRP (even if they don’t work the way they were intended).
But the back end, the longer run expectations, is where the market can interpret the Fed’s intentions. Unlike in mainstream rhetoric, it is not only possible for the Fed to be wrong in what it is doing, it’s possible to likewise be wrong about why it’s doing what it is doing. Some may even reasonably conclude that it’s likely, stemming from a constant tendency to stress the wrong things and to read into prices and data more than what’s really there.
That’s the max 3% scenario, the one where commodity prices via lower slopes and the Treasury curve flattening really all agree. The Fed is “raising rates” because things look better now than in 2016. You know what they say about appearances.
It’s where JPY seems intent on going, countering CNY. Rising yen and rising yuan both yield a falling dollar, but two very different versions.
