Yen crosses have moved lower with equities, commodities and a weaker US dollar. But it is the GBP/JPY that may be hinting that a major move in FX is about to happen.
What a difference a day makes it seems, as overnight the entire world appeared to throw the Trump reflation trade on the scrap heap. The catalyst appears to have been Obamacare and the difficulty he is having getting that repealed. The vote tomorrow on this hangs in the balance. The logic follows that if he can’t get this repealed with Republican majorities in both houses, and his “border control adjustments” keep getting knocked back as unconstitutional by that annoyingly independent judiciary, what hope then off this fabled tax reform and infrastructure spending?
With the first 100 days of action quickly becoming 100 days of inaction, the street seemed to have an epiphany last night and headed for the door. To be fair, I think this has as much to do with positioning as it does with politics. The street having thrown the kitchen sink at the Trump tax/reflation trade since the start of the year. The warning signs have been there since last week’s FOMC in the shape of a weaker USD pretty much across the board. Last night’s sell-off continued that theme, only this time it was equities and base metals that rolled over, and bond yields marched lower. The USD continued its sell-off against everything except the commodity currencies.
The contest to be the ugliest horse in the glue factory continues today with equities a sea of red across Asia, AUD and NZD down and the USD lower against GBP, EUR and JPY to name but a few. The JPY as a high beta to U.S. yield differentials is of particular interest. Rallying aggressively against the USD since last week and this morning is nibbling at support around 111.50. But a look at the yen crosses shows some very interesting price action indeed.
USD/JPY
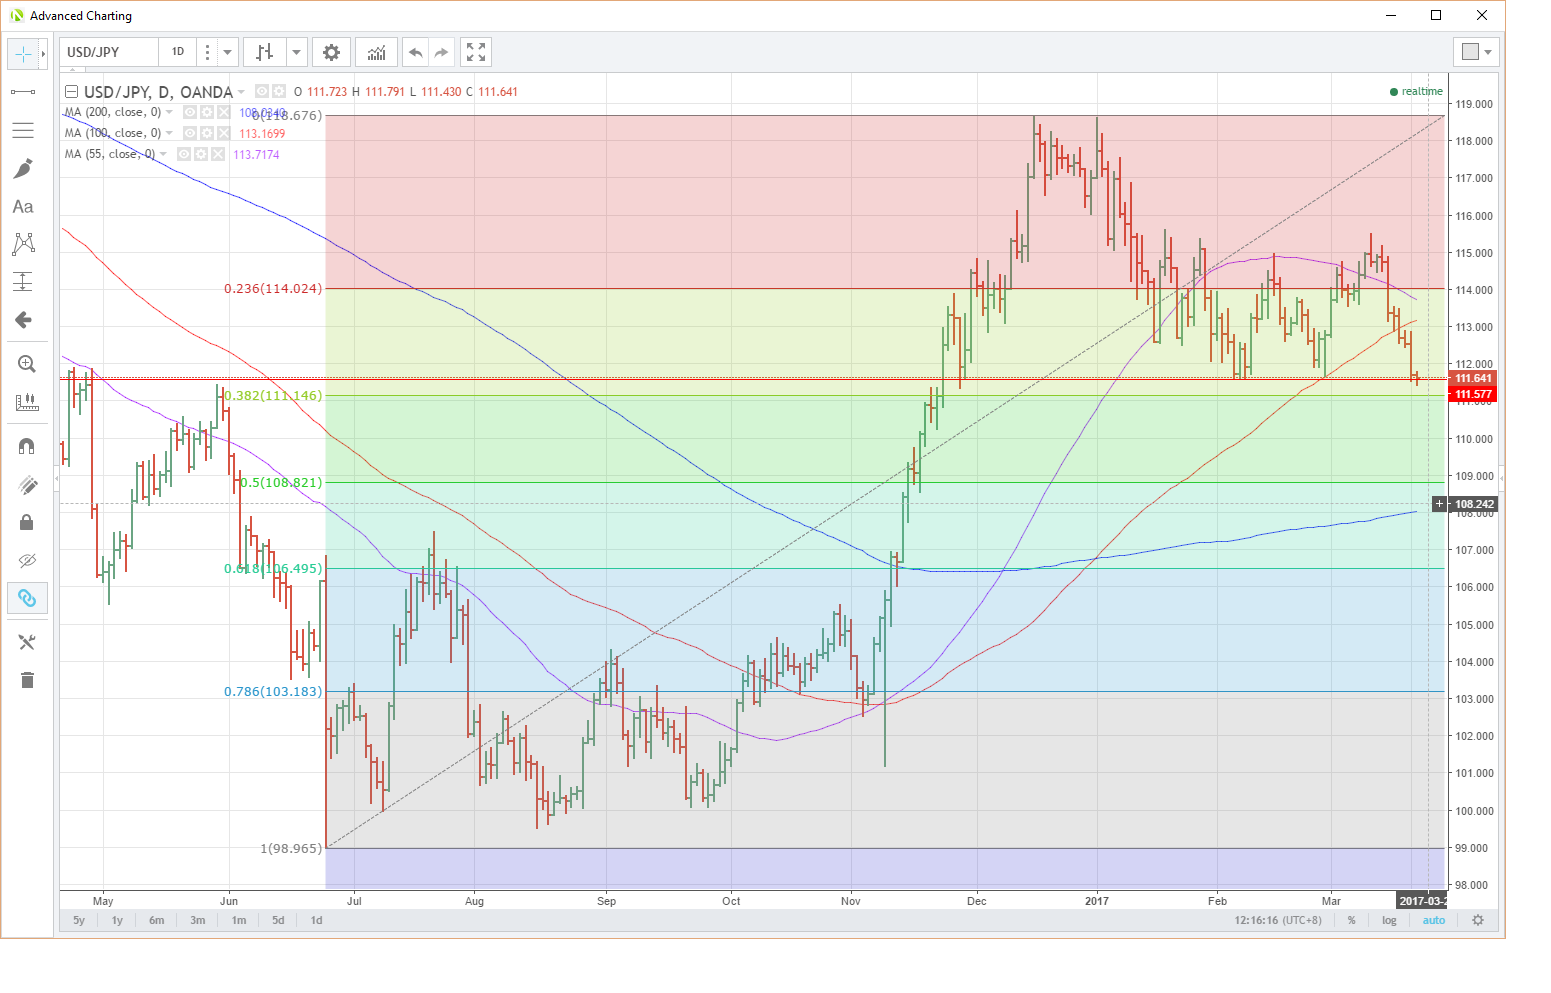
USD/JPY is sitting just above crucial support today. A series of daily lows from the start of the year sit in this 111.40/60 region. More importantly, the 38.2% Fibonacci retracement is also nearby, just below at 111.15. Asia appears to have run out of the will to test this area in its session with USD/JPY having bounced slightly to 111.64.
However, a daily close now under these levels at say 111.00, would potentially open a move to the 50% retracement at 108.80.
Resistance lies above in the shape of the 55 and 100-day moving averages at 113.70 and 113.17.
USD/JPY Daily
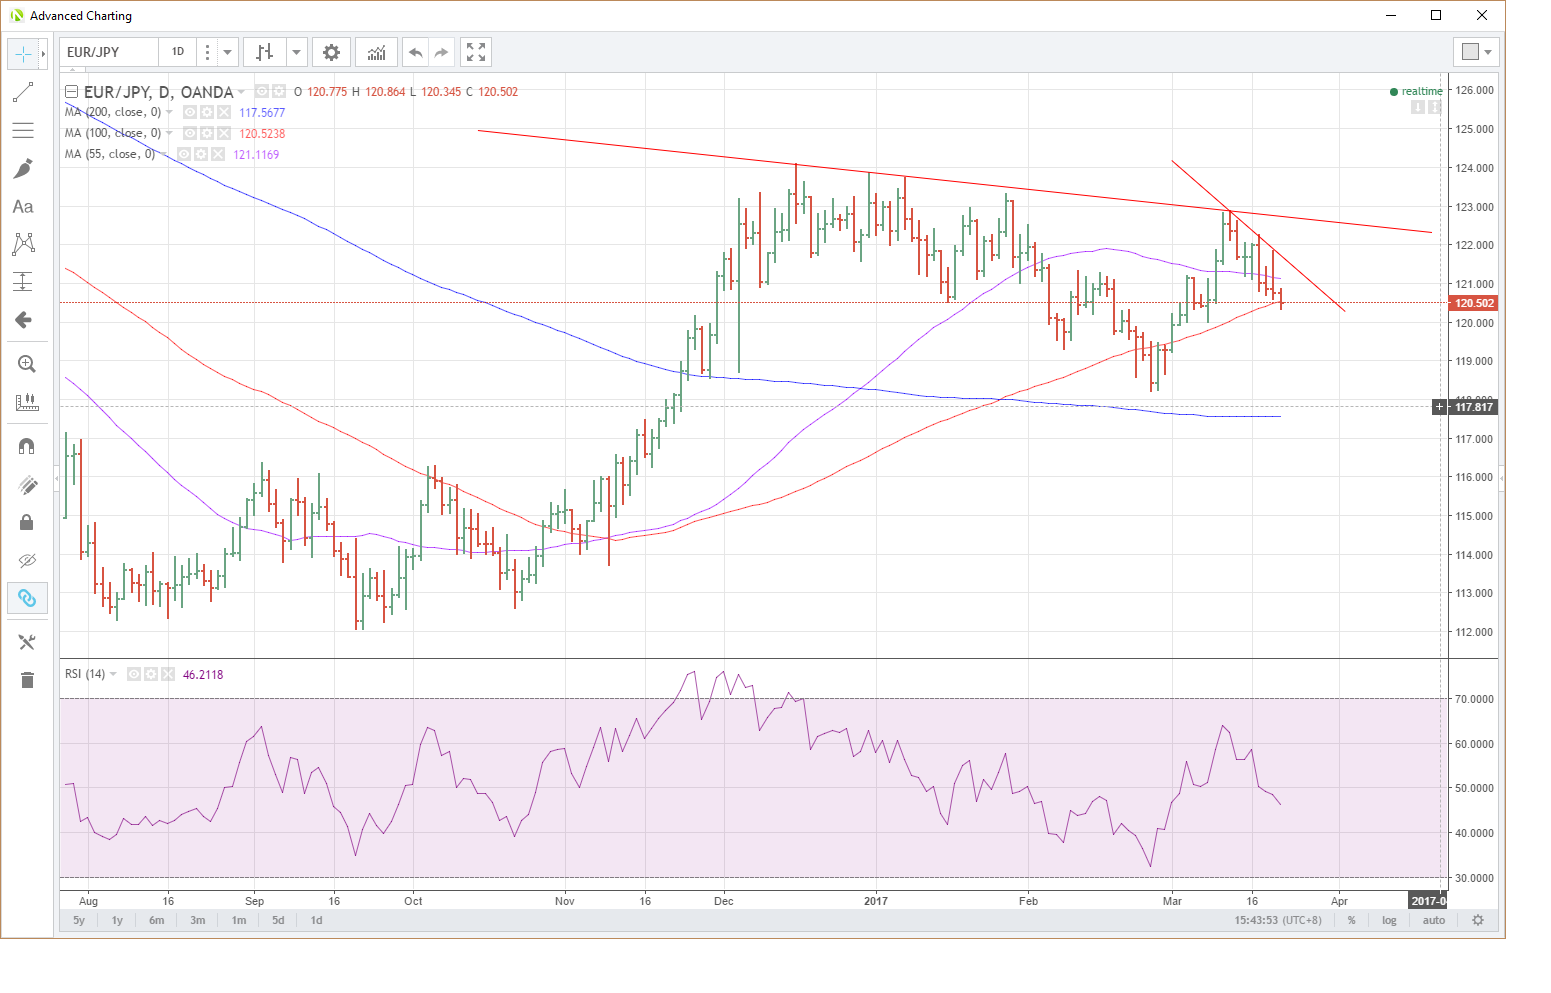
More neutral than Switzerland at the moment, sitting in the middle of its year to date range. The rise in the euro offsets the rally in the yen against the USD. That probably implies that the Europe story isn’t such a story to many in Asia, whereas the U.S. is. However, EUR/JPY is attacking its 100-day moving average at the moment at 120.52. A daily close below here could see a move to first support at 120.00 with a break here opening up a move back to the low 118’s.
Resistance is at the descending short-term trend line at 121.65 and then the longer term trend-line at 122.70.
EUR/JPY Daily
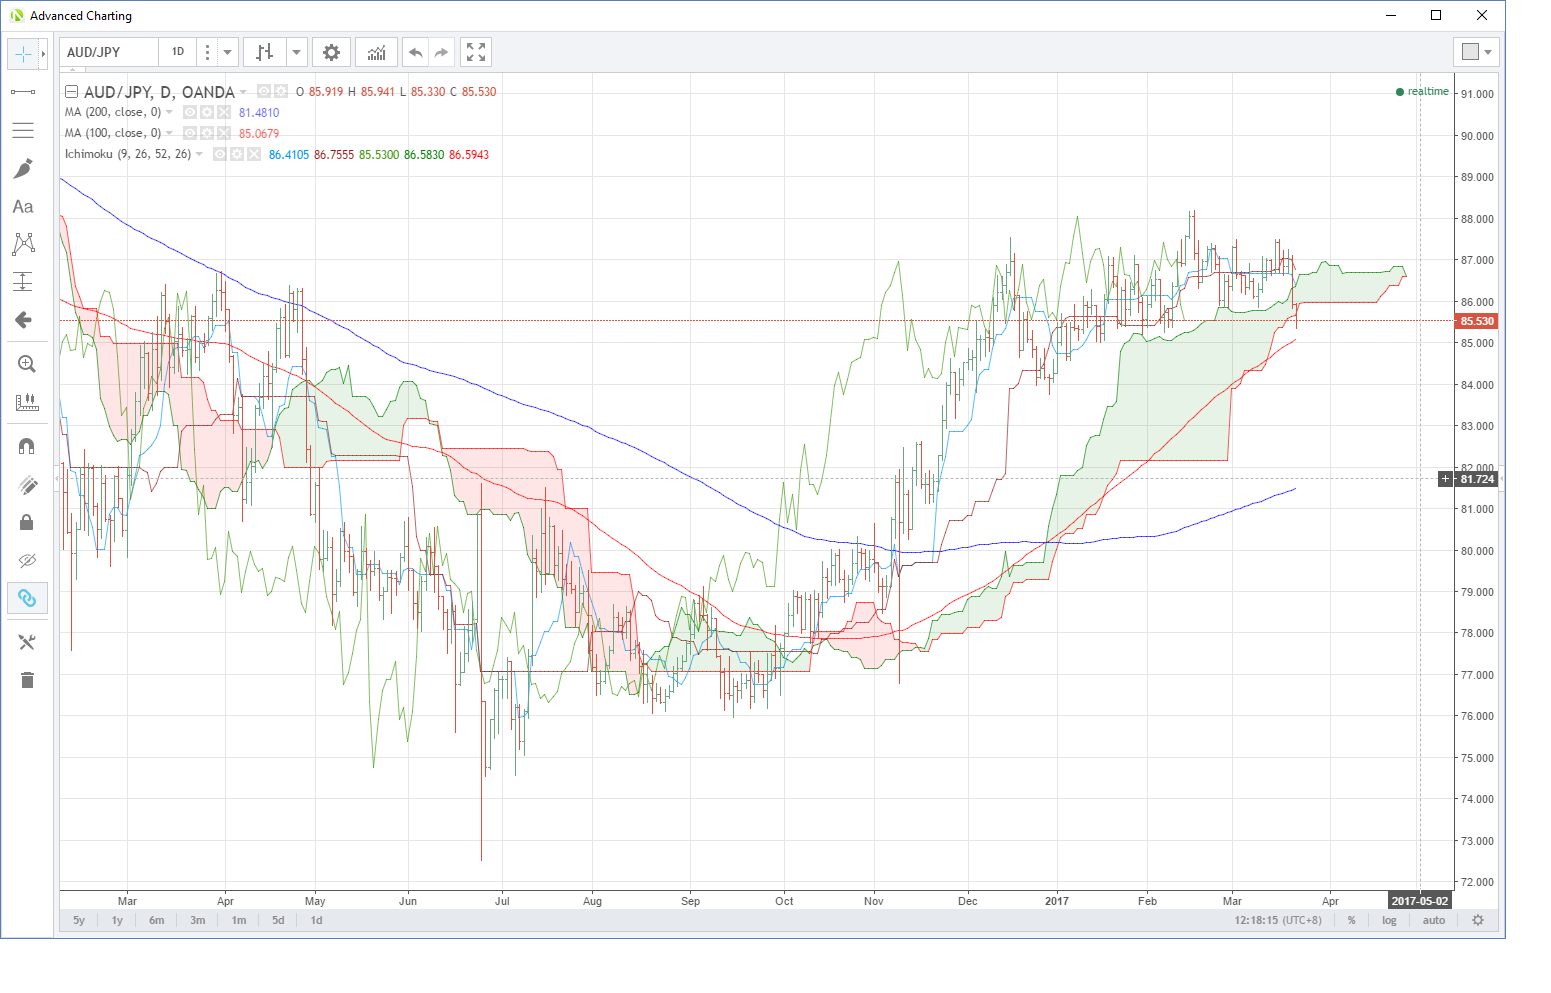
AUD/JPY has suffered a double whammy today as falling iron and copper prices mean the AUD is one of the few currencies to fall against the USD overnight. This has seen the AUD/JPY cross break below its daily Ichi moko cloud at 85.65 in Asian trading. The next support is 85.00, the 100-day moving average and a series of daily lows from early January. A close below this level opens up a possible technical move to 83.70, the low of the 29th December after which the chart has a lot of clear air.
Resistance comes in the shape of the top of the daily cloud and the 55-day moving average both at 86.35. Following this is a quadruple top at 87.50 and then February’s high at 88.20.
The daily RSI offers no relief for bulls either being sat just below 50.
AUD/JPY Daily
In much the same boat as the AUD, suffering from softer global commodity prices. The NZD has the extra flavour of an RBNZ rate decision tomorrow morning. Softer data recently may mean the RBNZ is a bit more dovish than the market is expecting. The timing would be perfect given their favourite hobby is talking the kiwi down.
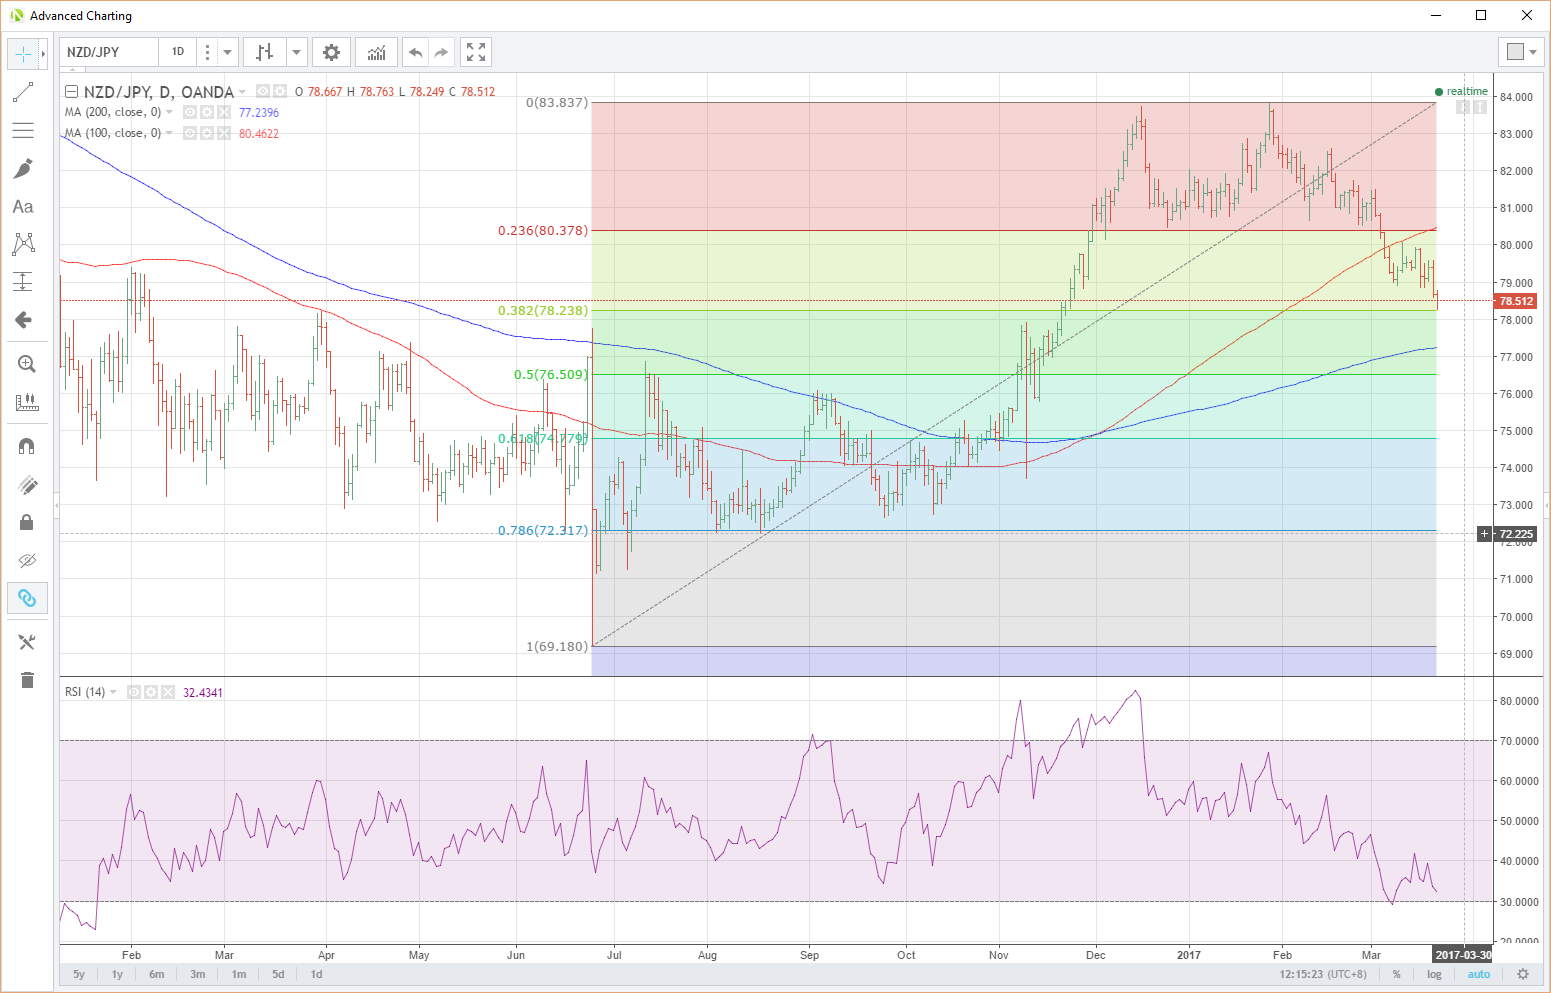
The NZD/JPY crossing has tested its 38.2% retracement at 78.24 before a dead cat bounce to 78.50. A daily close under this important level opens up 78.00 initially and then the 200-day moving average at 77.24. Some respite could be temporarily found in the RSI which is moving towards oversold levels.
Resistance is at 79.60, a double top, followed by 80.10 and then the 100-day moving average at 80.46. This region is also the 23.6 retracement and a series of daily lows and is now major resistance on the chart.
NZD/JPY Daily
GBP/JPY
This chart ranks as my scariest of the day as I struggle to recall ranges as compressed as these on the GBP/JPY cross over a multi-month time frame.
I am interpreting this as an almost symmetrical triangle meaning that a substantial break is coming as we move to the apex. The problem being that the break when it comes can move either up or down, and technically by the length of the base of the triangle. In this case, I am interpreting that as the 15th December high at 148.45 to 135.45, the baseline of the same date. So that is 13 big figures!
In a nutshell, when this triangle breaks, as it must very shortly, the targets will be either 122.65 or 153.00 give or take on a technical basis. I know not which way the break will come. Perhaps the chart is telling us that GBP itself is about to have a massive rally as we head to official Brexit? Or maybe that USD/JPY is destined for much lower levels as is GBP/USD?
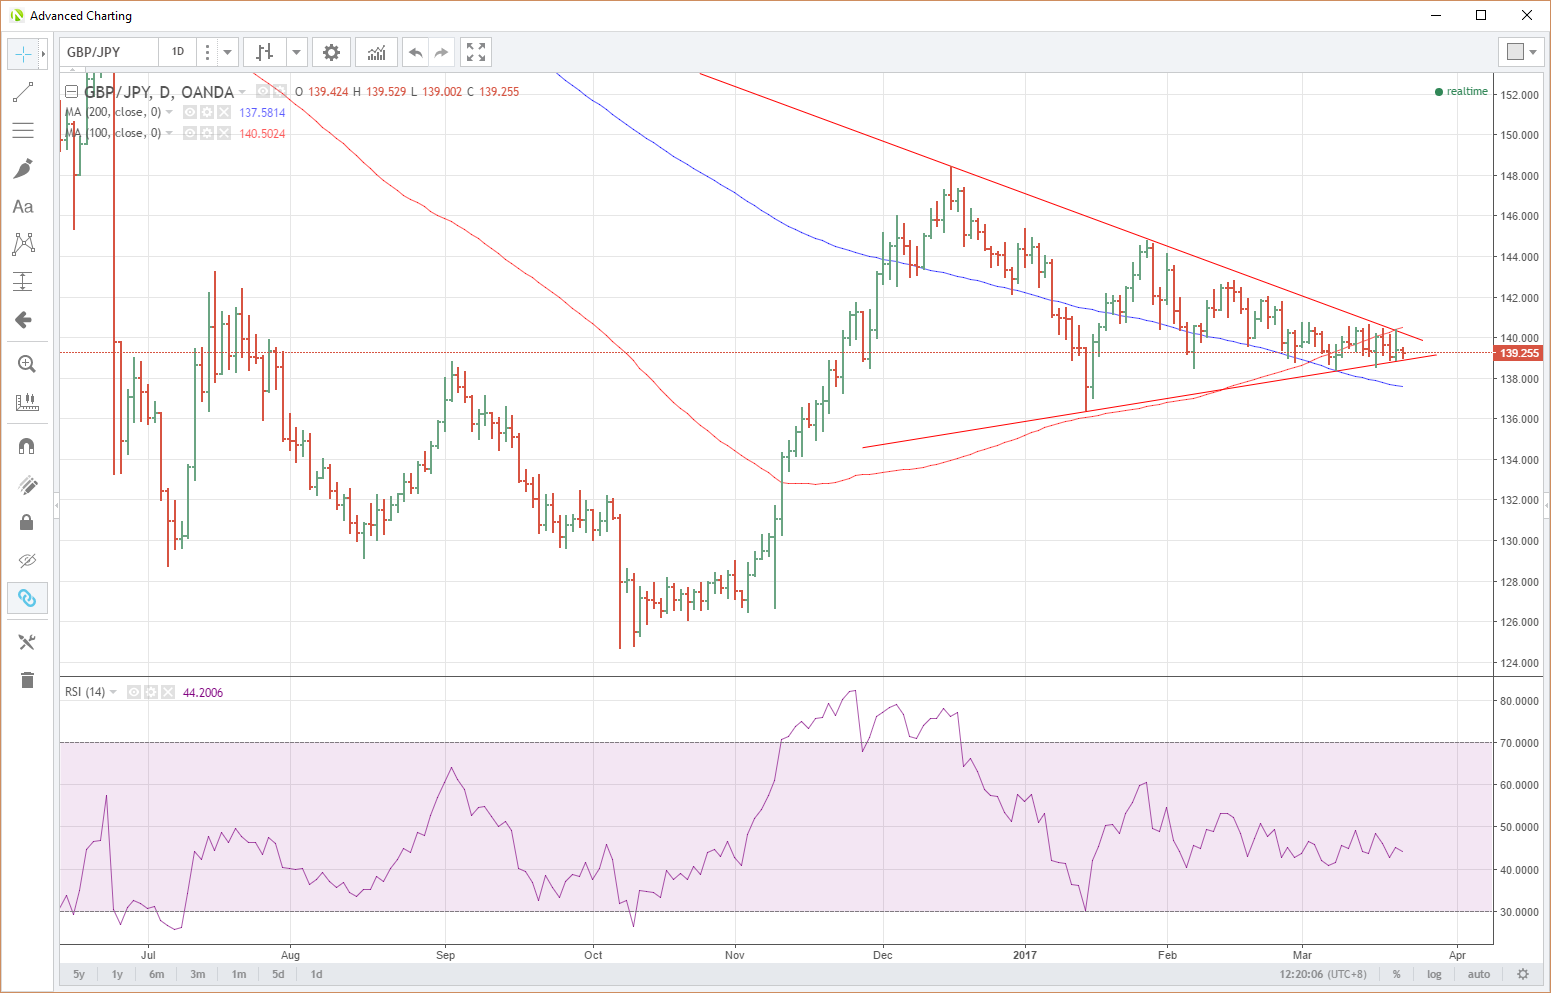
GBP/JPY Daily
Conclusion
Equities have now followed the USD correction, and the U.S. bond market as Trumphoria give way to Trumpointment. USD, in particular, is suffering against the Japanese yen and this, in turn, has set up bearish technical pictures on some very important yen crosses.
Perhaps the best indicator of the next significant move in the short term could be GBP/JPY, where unusually compressed ranges in a symmetrical triangle pattern, hint that a very large movement may be about to happen.
