Janet Yellen goes to Congress and promises a bigger bubble in the Dow Jones Industrial Average
Janet Yellen made it very clear in her confirmation hearing last week that she intended to continue the current easy money policies in support of the economy, employment and the Dow Jones Industrial Average. (DIA) She claimed to not see any current asset bubbles, but then, that’s typical of bubbles which usually aren’t visible except in hindsight.
She also mentioned that the economy was performing well below potential, that she intended to support the recovery, sees no build of global financial risks, not much evidence of excessive risk taking in search for yield and that she’ll keep her eyes open for any asset bubbles.
As the old saying goes, “Good luck with that.”
But the market took her at her word and the Dow Jones Industrial Average (DIA) along with the SP500 (SPY) and Nasdaq (QQQ) all advanced on Friday and for the week.
The SP500 (SPY) gained 1.6% for the week while the Dow Jones Industrial Average (DIA) climbed 1.3%.
On My Stock Market Radar
On a technical basis, the Dow Jones Industrial Average (DIA) has broken all short term resistance and now is pushing against extended resistance levels dating as far back as 1999.
Long term channel trend lines like this are significant, and so the next week’s and months will be critical for the long term health of the current bull market.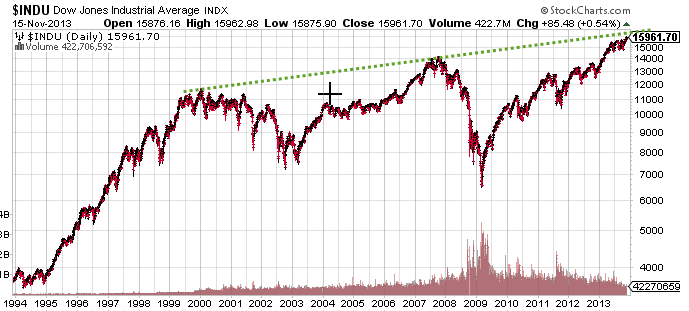
A look at the broader NYSE paints the same picture, with the index up against long term resistance dating back to the 2007 highs.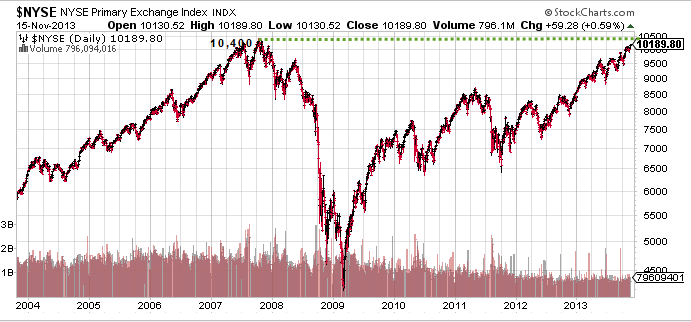
So one of the most powerful bull markets in history appears set to continue as Janet Yellen promises more easy money, however, she will have to overcome multi-year resistance levels in order to succeed.
Stock Market News You Can Really Use
Last week’s economic data largely supported the case for more easy money as the November Empire Index fell to -2.2, widely missing expectations and far below last month’s +1.5. October Industrial Production was also a disappointment, registering -0.1% compared to last month’s +0.7%. The National Federation of Independent Business sentiment gauge also dropped in October compared to the previous month’s reading.
Next week will bring a number of closely watched economic reports:
Monday: November Home Builders Index
Wednesday: October Retail Sales, October Consumer Price Index, October Existing Home Sales, FOMC meeting minutes
Thursday: weekly jobless claims, Markit Flash PMI, November Philadelphia Fed, October Leading Economic Indicators
Where Are We Now?
Dr. Yellen’s testimony essentially confirmed the failure of the Fed’s program thus far to bolster economic growth and employment to levels it considers to be satisfactory, and her fix is to do more of the same. Many analysts see her as being even more dovish than Dr. Bernanke, and so instead of a tapering of quantitative easing in 2014, we could see an expansion under the Yellen Fed, particularly as economic growth appears to be stalling.
Nevertheless, this could be good news for stock market bulls as easy money forces capital into equity markets in search for yield. Furthermore, panic buying appears to be setting in as many long time stock market bears are capitulating and calling for higher prices ahead. Newsletter writers are extremely bullish, and while the Dow Jones Industrial Average (DIA) and other major indexes could continue higher, excessive bullishness is typically a contrarian indicator.
The disconnect between the “real” economy and the “financial” economy is obvious as stock indexes make record highs while the real economy continues to founder. Quantitative easing is the force behind this disconnect and the Fed now finds itself in the proverbial “liquidity” trap (between a rock and a hard place) as it needs to disengage from quantitative easing but can’t.
Here are the stats from the “real” economy:
1. Small business optimism is falling, and this can only be bad news as small businesses are the primary drivers of American job growth.
2. Consumer sentiment remains in the doldrums and the consumer makes up 70% of the U.S. economy.
3. Earnings outlooks remain subdued.
4. Unemployment remains high.
5. Earnings and revenue growth are in the 1-1.5% range and close to going negative.
Beyond that, several other red flags fly as insiders continue selling at multi-year high levels and IPOs are at levels not seen since 2007, at the height of the last market top, and reminiscent of the dot com bubble in 2000 when companies with no earnings were selling at stratospheric levels.
Retail buyers continue rushing into the market and advisers are at extremely bullish levels which are both contrarian indicators as retail buyers tend to always be last to the party and buy high and sell low.
It’s widely known that bull markets go through three phases, as do bear markets. The first phase in a bull market is called the accumulation phase, where the “smart money” starts buying near market bottoms when stocks are cheap and widely hated by the investing public. This began sometime shortly after March, 2009, for today’s current bull market.
The second phase is where the public begins to enter the market and prices move up but a strong scent of fear still fills the air.
The third phase is wild, near panic buying and the sense that the bull will last forever and this appears to be where we are now, as fundamentals go out the window and greed, emotion and momentum are primary drivers of the ever rising market. The bears capitulate, and in today’s market, everyone is sure that the Fed has their backs and will continue driving the financial economy higher.
Bottom line: Bubbles never last forever, and this one won’t either. Prices could certainly climb higher from current levels. In fact, they likely will do just that as Dr. Yellen continues filling the punch bowl of easy money. So while there could be more opportunity on the long side, there will certainly be opportunity on the short side, most likely in the not too distant future.
Disclaimer: The content included herein is for educational and informational purposes only, and readers agree to Wall Street Sector Selector's Disclaimer, Terms of Use, and Privacy Policy before accessing or using this or any other publication by Wall Street Sector Selector or Ridgeline Media Group, LLC.
- English (UK)
- English (India)
- English (Canada)
- English (Australia)
- English (South Africa)
- English (Philippines)
- English (Nigeria)
- Deutsch
- Español (España)
- Español (México)
- Français
- Italiano
- Nederlands
- Polski
- Português (Portugal)
- Português (Brasil)
- Русский
- Türkçe
- العربية
- Ελληνικά
- Svenska
- Suomi
- עברית
- 日本語
- 한국어
- 简体中文
- 繁體中文
- Bahasa Indonesia
- Bahasa Melayu
- ไทย
- Tiếng Việt
- हिंदी
Yellen To Blow Bigger Bubble In Dow Jones
Published 11/17/2013, 11:35 AM
Yellen To Blow Bigger Bubble In Dow Jones
Latest comments
Loading next article…
Install Our App
Risk Disclosure: Trading in financial instruments and/or cryptocurrencies involves high risks including the risk of losing some, or all, of your investment amount, and may not be suitable for all investors. Prices of cryptocurrencies are extremely volatile and may be affected by external factors such as financial, regulatory or political events. Trading on margin increases the financial risks.
Before deciding to trade in financial instrument or cryptocurrencies you should be fully informed of the risks and costs associated with trading the financial markets, carefully consider your investment objectives, level of experience, and risk appetite, and seek professional advice where needed.
Fusion Media would like to remind you that the data contained in this website is not necessarily real-time nor accurate. The data and prices on the website are not necessarily provided by any market or exchange, but may be provided by market makers, and so prices may not be accurate and may differ from the actual price at any given market, meaning prices are indicative and not appropriate for trading purposes. Fusion Media and any provider of the data contained in this website will not accept liability for any loss or damage as a result of your trading, or your reliance on the information contained within this website.
It is prohibited to use, store, reproduce, display, modify, transmit or distribute the data contained in this website without the explicit prior written permission of Fusion Media and/or the data provider. All intellectual property rights are reserved by the providers and/or the exchange providing the data contained in this website.
Fusion Media may be compensated by the advertisers that appear on the website, based on your interaction with the advertisements or advertisers.
© 2007-2025 - Fusion Media Limited. All Rights Reserved.