yEarn.Finance has seen its price skyrocket more than 240% since the beginning of the month, marking a new uptrend in the DeFi space.
Key Takeaways
- yEarn.Finance recently hit a critical resistance barrier that may have the strength to trigger a steep correction.
- The TD sequential indicator adds credence to the bearish outlook after it presented a sell signal on the 3-hour chart.
- An increase in downward pressure around the current price levels may see YFI retrace towards $25,000.
yEarn.Finance has seen its price rise over 25% in the past 24 hours. The bullish momentum looks capped at $30,100, however, as multiple sell signals begin to develop.
Steep Correction Ahead for yEarn.Finance
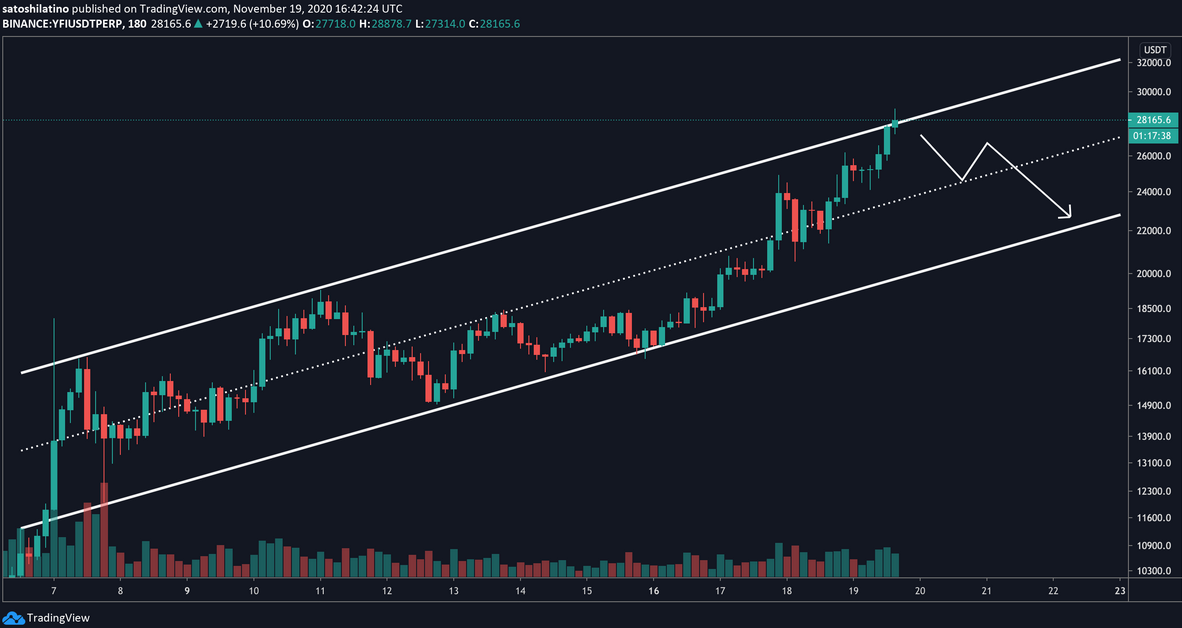
Yearn.Finance’s price action has been contained within an ascending parallel channel since the beginning of the month.
Each time YFI, the platform’s native token, has risen to this technical formation’s upper boundary, it gets rejected and retraces to the lower edge. From this point, it tends to rebound, consistent with the characteristics of a channel.
Following yesterday’s retest of the channel’s upper trendline, yEarn.Finance may be poised to pull back towards the middle or lower trendline like it did in the past few weeks.
These crucial areas of support sit at $25,000 and $22,500, respectively.

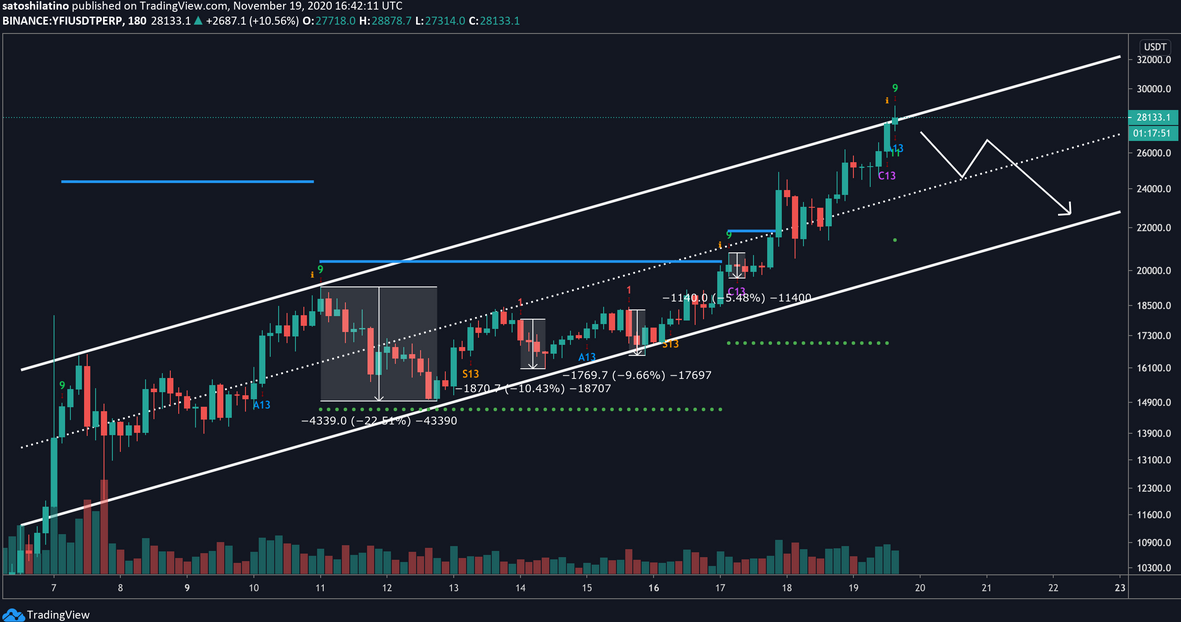
When looking at the TD sequential indicator, this thesis holds.
- This technical index presented a sell signal in the form of green nine candlesticks on YFI’s 3-hour chart. The bearish formation suggests that a spike in sell orders around the current price levels may lead to a one to four 3-hour candlesticks correction.
- A glimpse at the DeFi token’s 3-hour chart reveals that the TD setup has been incredibly accurate at anticipating local tops. The last four sell signals provided by this indicator were all validated, resulting in steep declines.
Therefore, the current pessimistic forecast must be taken seriously despite the massive gains that the yield aggregation platform has posted over the last 24 hours.

IntoTheBlock’s “In/Out of the Money Around Price” (IOMAP) model reveals that if downward pressure mounts, the channel’s middle trendline may hold and serve as a rebound zone.
Based on this on-chain metric, more than 230 addresses had previously purchased nearly 300 YFI between $24,200 and $25,100.
This critical demand barrier may keep falling prices at bay. Holders within this range will likely do anything to prevent seeing their investments go into the red. They may even buy more tokens, subsequently countering the downward pressure.

Regardless of the bearish outlook, the IOMAP cohorts also show that yEarn.Finance faces little to no resistance ahead. The most significant hurdle lies between $31,000 and $32,000, where over 480 addresses bought more than 250 YFI.
Since the bears’ odds favor only a 3-hour candlestick close above the recent high of $28,900 may jeopardize the pessimistic scenario and lead to a jump towards $31,500.
