Despite a horrible first quarter in 2020, when the average equity and fixed income fund (including ETFs) lost 22.33% and 4.56%, respectively, both asset classes were able to finish the year on strong footing, posting one-year returns of 15.63% and 5.28%, respectively. Even the average mixed-asset (target date and target risk) fund managed to put together a handsome 12.26% one-year return. Not bad considering the ground that needed to be retraced before the funds could move into positive territory.
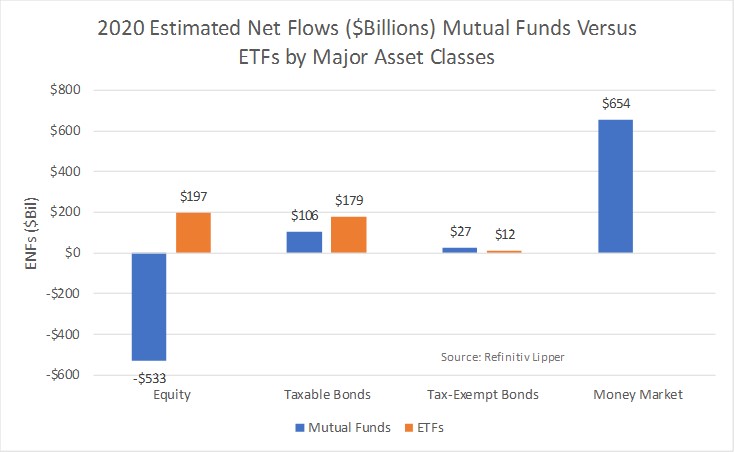
However, there is still a ton of cash sitting on the sidelines, waiting for the other proverbial shoe to drop. By December 31, 2020, estimated net flows into U.S. domiciled money market funds had reached $653.9 billion (based on preliminary year-end numbers), down from the $1.120 trillion pinnacle reached in May.
Conventional fund investors appeared to shrug off the strong rebound in equities, redeeming a net $532.6 billion during 2020, with conventional large-cap funds (-$295.1 billion) suffering the largest exodus (in spite of the average large-cap fund returning 21.78% for the year), bettered by international income funds (-$119.6 billion) and small-cap funds (-$32.3 billion). Conventional fixed income funds continued to attract net new money during 2020, with taxable bond funds taking in $105.6 billion and tax-exempt bond funds attracting some $26.9 billion.

However, exchange-traded funds continued to be the go-to instrument for all the asset classes. For 2020, equity ETFs took in $196.7 billion, while their taxable and tax-exempt fixed income counterparts attracted $178.7 billion (their largest one-year net inflow going back to 2002, when the first fixed income ETF began trading) and $12.0 billion, respectively.
As reported in the mainstream media over the last half of the year, much of the rally in equities was attributed to large tech and “stay-at-home” stocks. But since the creation and recent distribution of a COVID-19 vaccine and reopening of the global economies (albeit in fits and starts), a rotation out of the high-flying tech issues and into more out-of-favor stocks has begun.
Focusing just on flows into ETF classifications, we saw that in December Emerging Markets ETFs witnessed the largest draw of net new money, taking in some $6.8 billion for the month, followed by Multi-Cap Core ETFs (+$6.2 billion), and Small-Cap Core ETFs (+$6.1 billion). Sure, Science & Technology ETFs (+$4.8 billion) and Health/Biotechnology ETFs (+$3.6 billion) were still at the top of list, but it appears that investors are actively testing the water of the mid-year, out-of-favor classifications.
The five-top ETF attractors of investors’ assets in December were Vanguard Total Stock Market Index ETF (NYSE:VTI), +$5.3 billion, iShares Core MSCI Emerging Markets ETF (NYSE:IEMG), +$3.6 billion, iShares Russell 2000 ETF (NYSE:IWM), +$3.2 billion, ARK Innovation ETF (NYSE:ARKK), +$2.9 billion, and ARK Genomic Revolution ETF (NYSE:ARKG), +$2.8 billion.
For the last month of the year, the favored darlings of 2020—S&P 500 Index ETFs (-$13.5 billion) and Large-Cap Core ETFs (-$4.9 billion)—witnessed the largest net outflows. A couple of interesting year-end observations to note, as might be expected with the recent change in political power in the U.S., Inflation Protected Bond ETFs got a little attention, taking in $2.3 billion for December, while Loan Participation ETFs (aka leverage loan funds) attracted some $808 million for the month.
