Yahoo! Inc. (YHOO) is a digital media company. Yahoo! provides engaging and canvases for advertisers to connect with their target audiences.
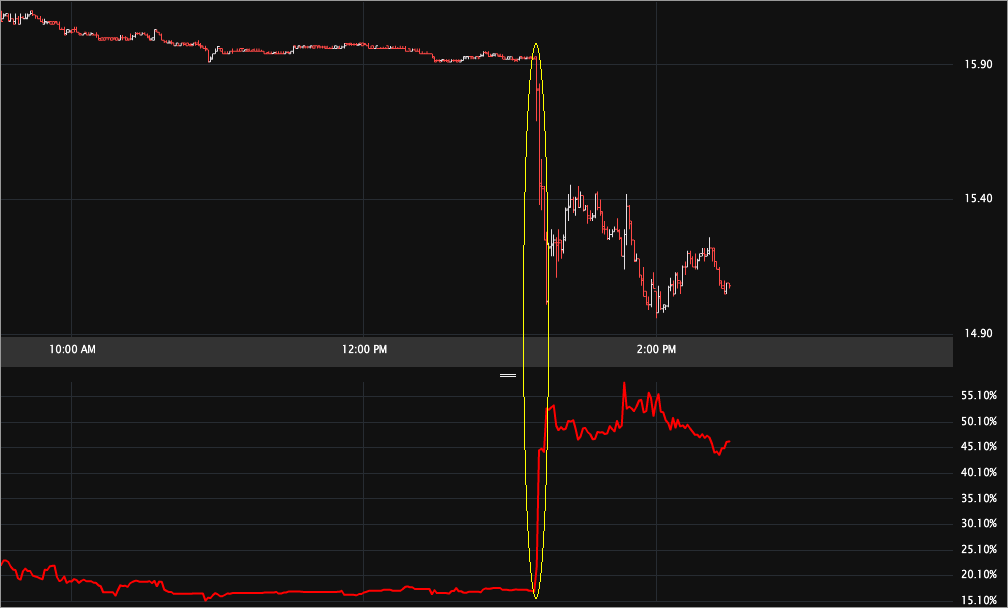
The stock plummeted midday yesterday with vol exploding up 25%. I've included the tick chart below -- the top is the stock price, the bottom the vol (one-minute ticks for day).

Check out the move -- the stock fell off a cliff as vol popped. Here's the midday news that acted as the catalyst:
"(Reuters) - Yahoo Inc and its Asian partners, China's Alibaba and Japan's Softbank Corp, have called off talks over a tax-free sale of the U.S. company's prized Asian assets, a source familiar with the situation told Reuters.
Collapse of the proposed deal -- referred to as a cash-rich split-off -- would mark the latest setback for an erstwhile Internet media giant now struggling to turn its business around and appease unhappy shareholders.
The source, confirming a report by the influential technology blog AllThingsDigital, said the deal "hit a series of snags" that ultimately buried it. But the source said Yahoo and its Asian partners could still strike another, taxable deal, though that remained to be seen." -- Source: Reuters via Yahoo! Finance Yahoo-Alibaba talks called off after snags: source
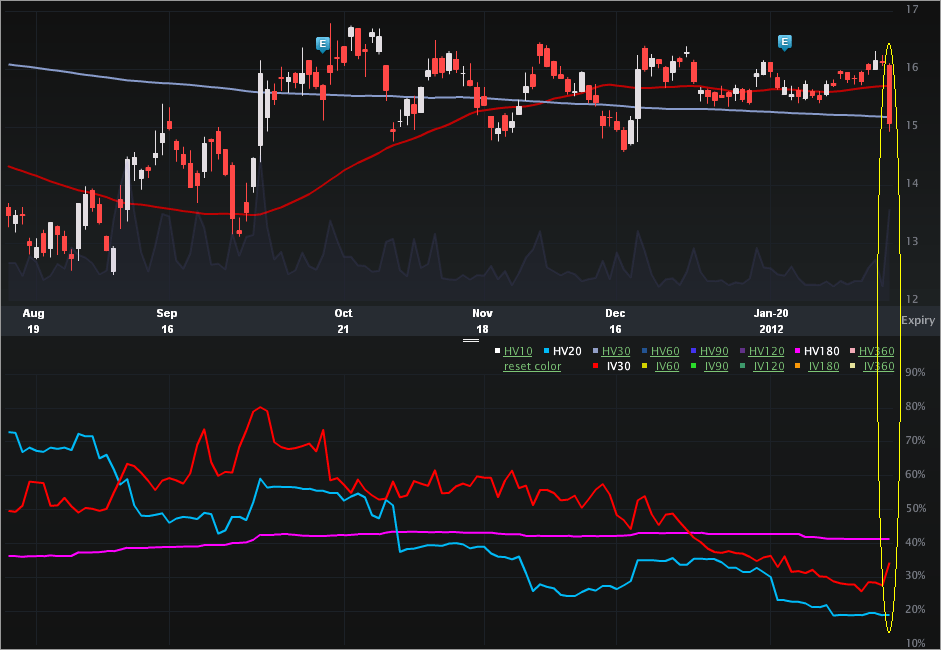
Ouch! Let's turn to the Charts Tab (six months), below. The top portion is the stock price, the bottom is the vol (IV30™ - red vs HV20™ - blue vs HV180™ - pink).

We can see the stock has been a fairly tight range over the last three months -- don't let the gyrations fool you, look at the values on the vertical axis to see how "calm" the stock has been. On the vol side, it's very cool how the HV20™ has led the IV30™ down. Those measures are below the long-term historical realized vol (HV180™). The HV10™ is even lower, coming out to 13.53% (annualized). The vol comps right now are:
IV30™: 34.55%
HV10™: 13.53%
HV20™: 18.78%
HV180™: 41.30%
We see lower realized vols as the time-frame shortens. One thing to note, the HV is calculated close-to-close, so those short-term measures will show a spike tomorrow.
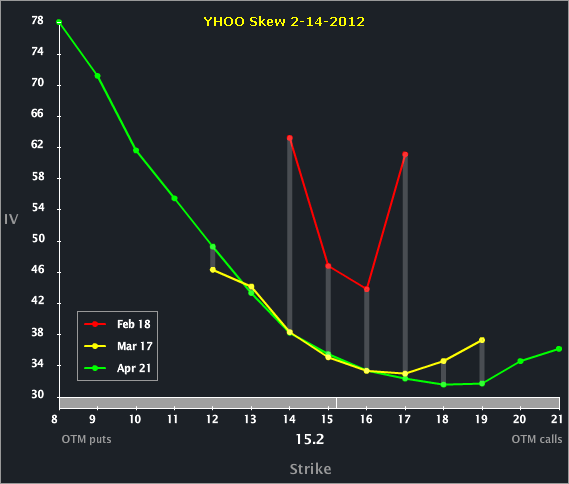
Let's turn to the Skew Tab.

Mar and Apr lie right on top of each other, while Feb is elevated (and rightly so, given the news). One point of interest, the next earnings release seems to be the Monday after Apr expo.
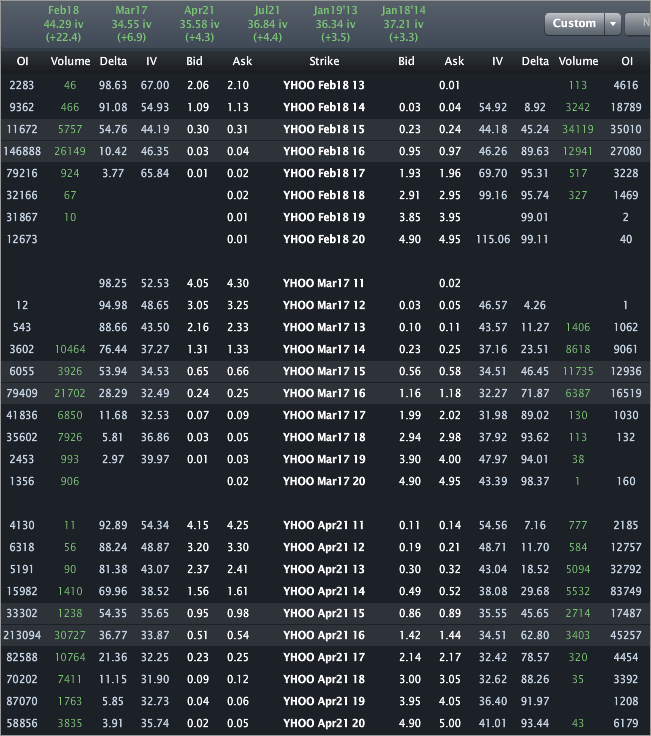
Finally, let's turn to the Options Tab.

The monthly vols are priced to 44.29%, 34.55% and 35.58%, respectively for Feb, Mar and Apr. It's incredible to see those Feb 16 calls @ $0.04 when the day high was $16.10 today and $16.24 yesterday.
This is trade analysis, not a recommendation.
The stock plummeted midday yesterday with vol exploding up 25%. I've included the tick chart below -- the top is the stock price, the bottom the vol (one-minute ticks for day).

Check out the move -- the stock fell off a cliff as vol popped. Here's the midday news that acted as the catalyst:
"(Reuters) - Yahoo Inc and its Asian partners, China's Alibaba and Japan's Softbank Corp, have called off talks over a tax-free sale of the U.S. company's prized Asian assets, a source familiar with the situation told Reuters.
Collapse of the proposed deal -- referred to as a cash-rich split-off -- would mark the latest setback for an erstwhile Internet media giant now struggling to turn its business around and appease unhappy shareholders.
The source, confirming a report by the influential technology blog AllThingsDigital, said the deal "hit a series of snags" that ultimately buried it. But the source said Yahoo and its Asian partners could still strike another, taxable deal, though that remained to be seen." -- Source: Reuters via Yahoo! Finance Yahoo-Alibaba talks called off after snags: source
Ouch! Let's turn to the Charts Tab (six months), below. The top portion is the stock price, the bottom is the vol (IV30™ - red vs HV20™ - blue vs HV180™ - pink).

We can see the stock has been a fairly tight range over the last three months -- don't let the gyrations fool you, look at the values on the vertical axis to see how "calm" the stock has been. On the vol side, it's very cool how the HV20™ has led the IV30™ down. Those measures are below the long-term historical realized vol (HV180™). The HV10™ is even lower, coming out to 13.53% (annualized). The vol comps right now are:
IV30™: 34.55%
HV10™: 13.53%
HV20™: 18.78%
HV180™: 41.30%
We see lower realized vols as the time-frame shortens. One thing to note, the HV is calculated close-to-close, so those short-term measures will show a spike tomorrow.
Let's turn to the Skew Tab.

Mar and Apr lie right on top of each other, while Feb is elevated (and rightly so, given the news). One point of interest, the next earnings release seems to be the Monday after Apr expo.
Finally, let's turn to the Options Tab.

The monthly vols are priced to 44.29%, 34.55% and 35.58%, respectively for Feb, Mar and Apr. It's incredible to see those Feb 16 calls @ $0.04 when the day high was $16.10 today and $16.24 yesterday.
This is trade analysis, not a recommendation.
