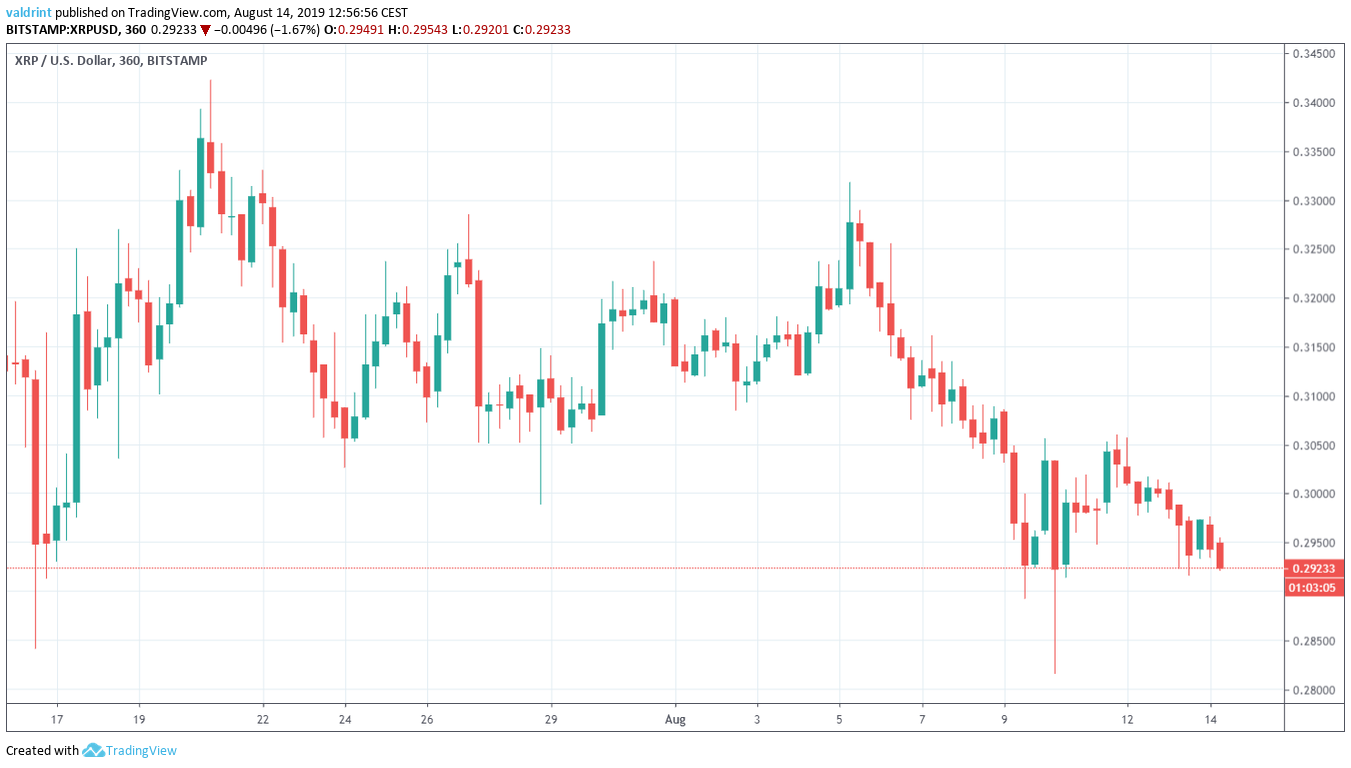
On July 16, 2019, the XRP price reached a low of $0.285. An upward move ensued. On July 20, XRP reached a high of $0.34. After a period of consolidation and a failed upward move on August 5, XRP began a downtrend. It reached values close to $0.29 on two occasions — August 9 and 13.
Will the XRP price decrease below $0.29 or will it begin an upward move? Keep scrolling below if you are interested in finding out.
XRP Price: Trends and Highlights for August 14
XRP Price in a Descending Triangle
A look at the six-hour time-frame shows that XRP has been trading inside a descending triangle since July 12.
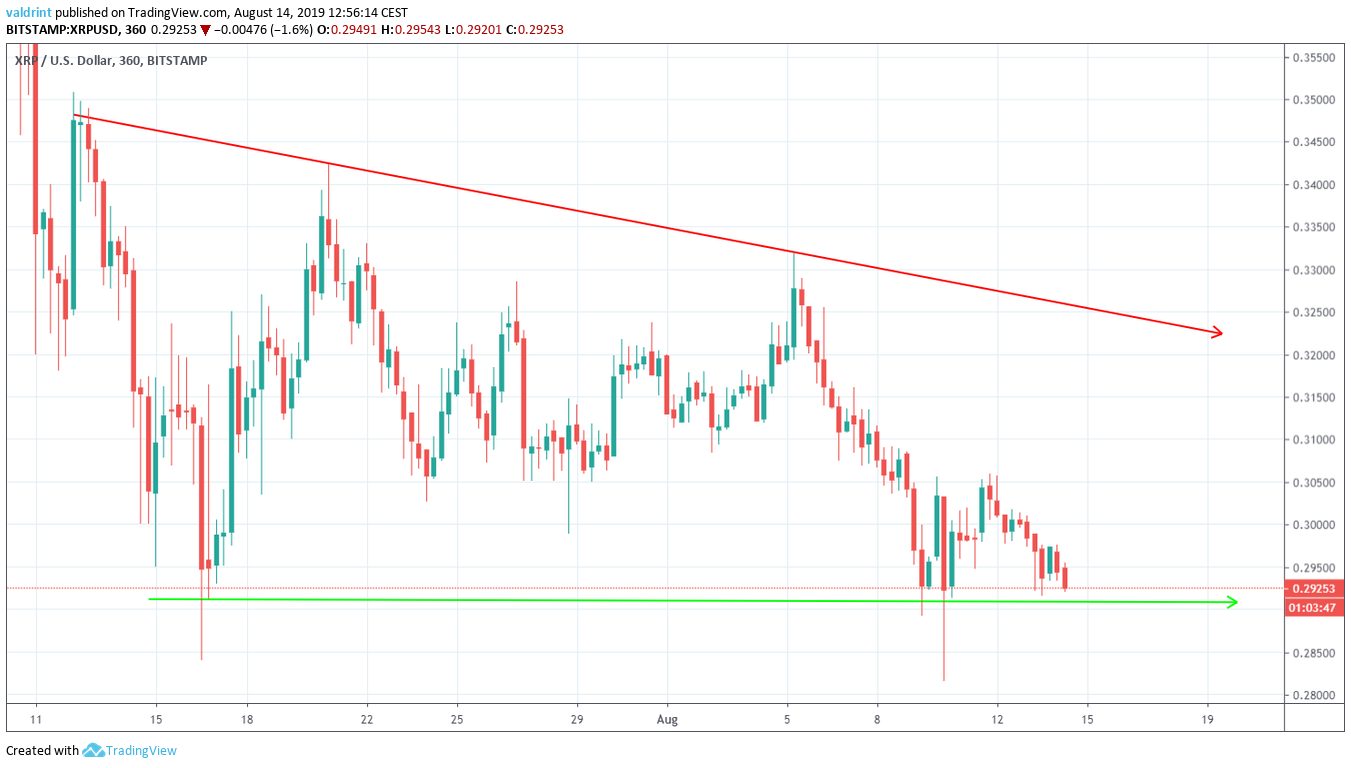
The descending triangle is considered a bearish pattern, making a price breakdown more likely.
At the time of writing, the XRP price was trading right on the support line of the triangle.
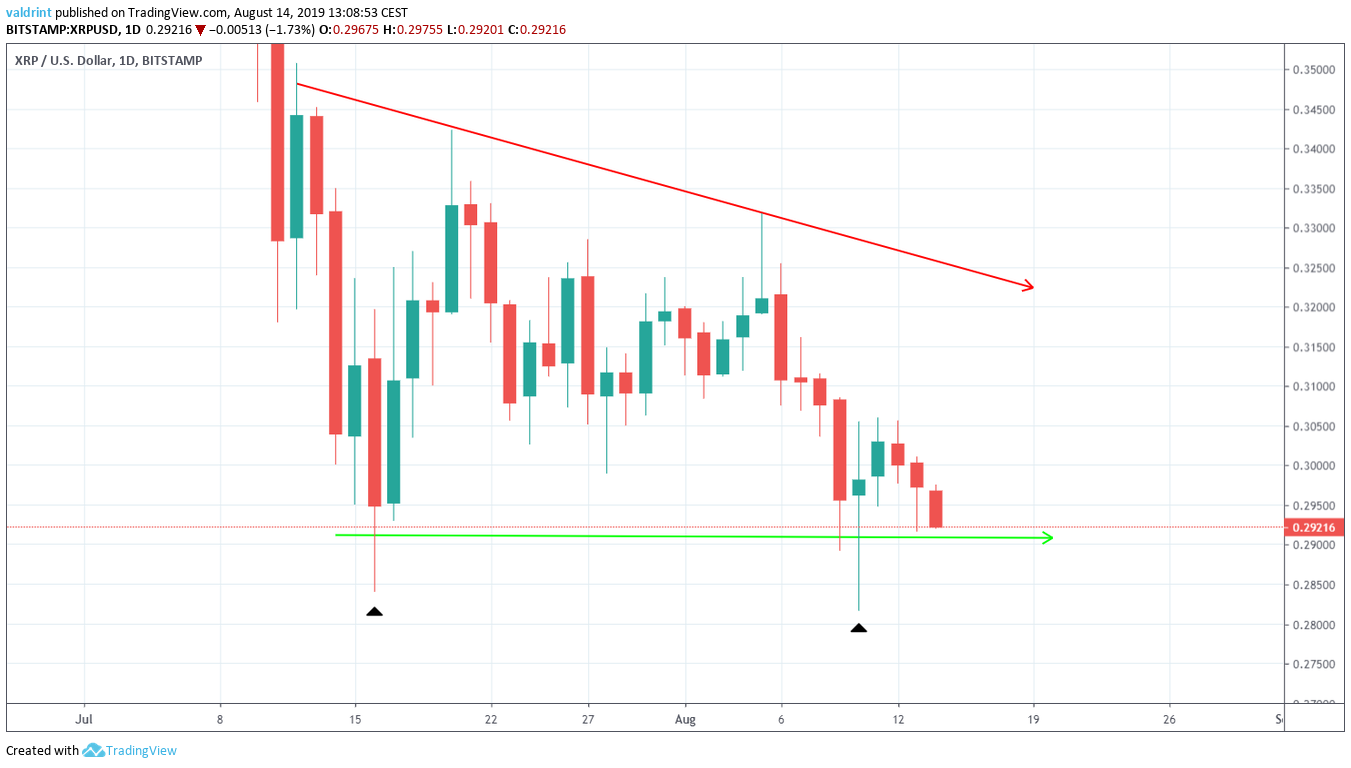
Despite the descending triangle being a bearish pattern, XRP has shown some bullish signs.
These are visible in the long lower wicks of July 16 and August 10.
Additionally, the bullish doji on August 10 could be considered a reversal sign — especially if it follows several bearish candlesticks.
However, the ensuing upward move did not go further than the opening price of the prior bearish engulfing candlestick.
Instead, the XRP price reversed and touched the support line.
Technical Indicators
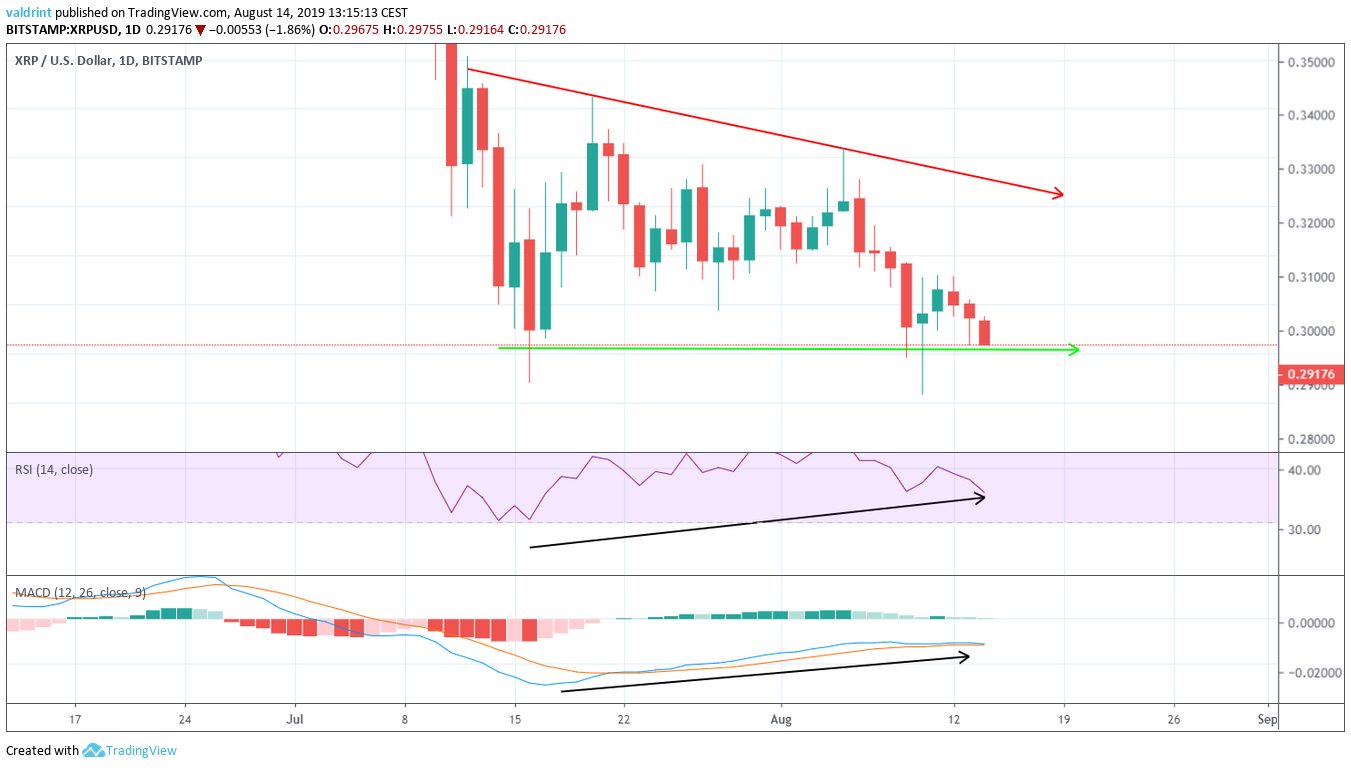
A look at the RSI and MACD shows a significant bullish divergence that has been generating over the entire duration of the triangle.
This is often a sign that an upward move will soon begin.
It gains more significance since it is occurring at a support line and is present in both indicators.
Therefore, we believe an upward move towards the resistance line is likely.
Since the descending triangle is considered a bearish pattern, we cannot confidently predict a breakout.
Short-Term
A closer look at the XRP price reveals that it is trading inside a descending wedge.
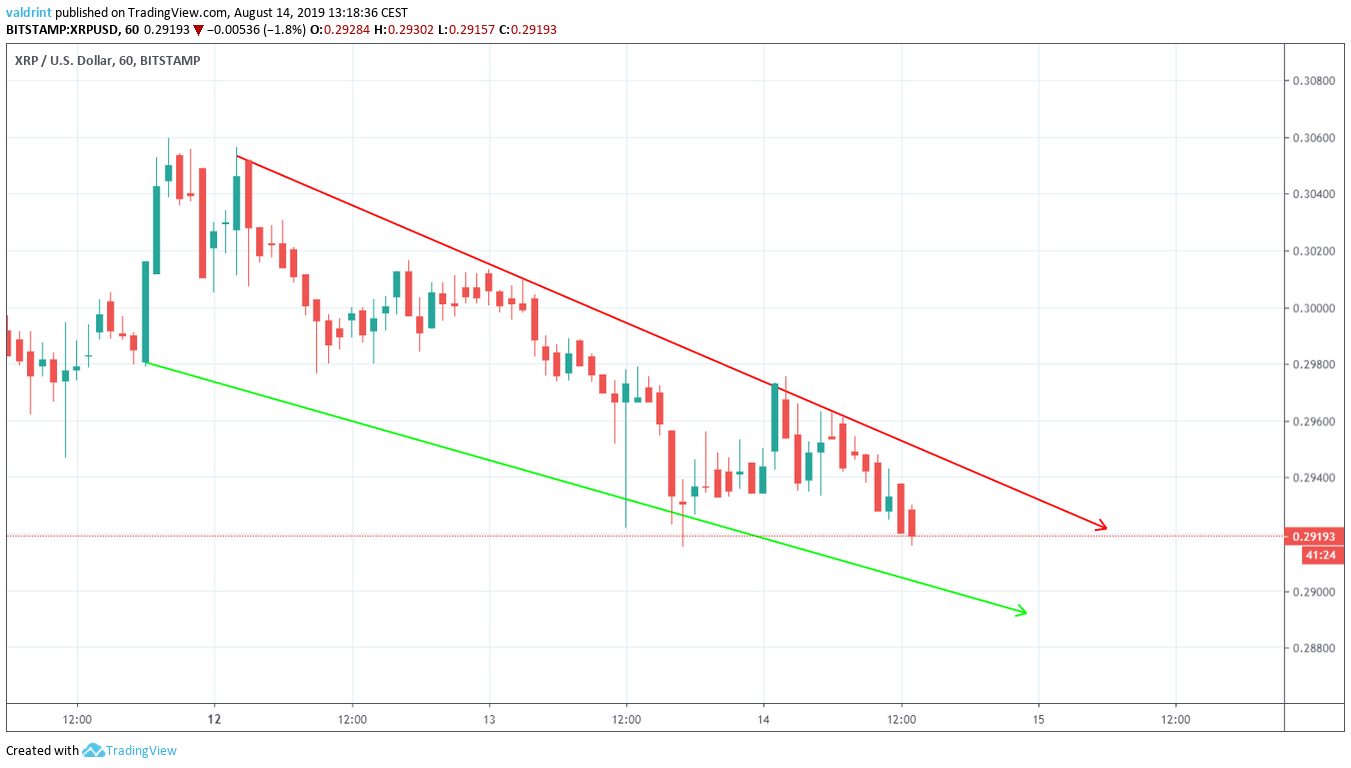
Since we believe an upward move will begin, the creation of the wedge (a bullish pattern) supports our prior analysis.
If the XRP price breaks out from the wedge, one resistance area is outlined below.
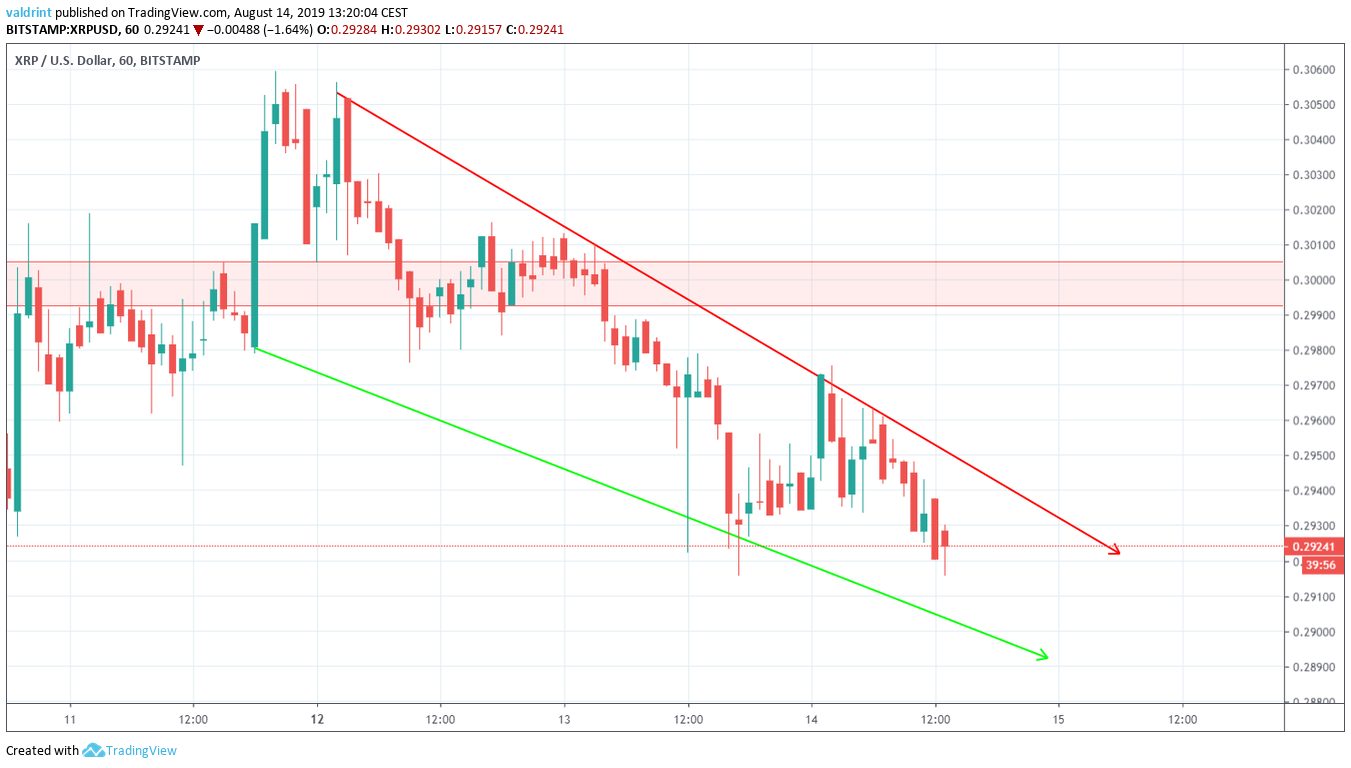
The resistance area is found at $0.30.
While we do not believe it will initiate a downward reversal, it is likely to provide a short-term one.
XRP Price Summary
The XRP price is trading inside a descending triangle.
According to our analysis, it is likely to move towards the resistance line of the triangle.
