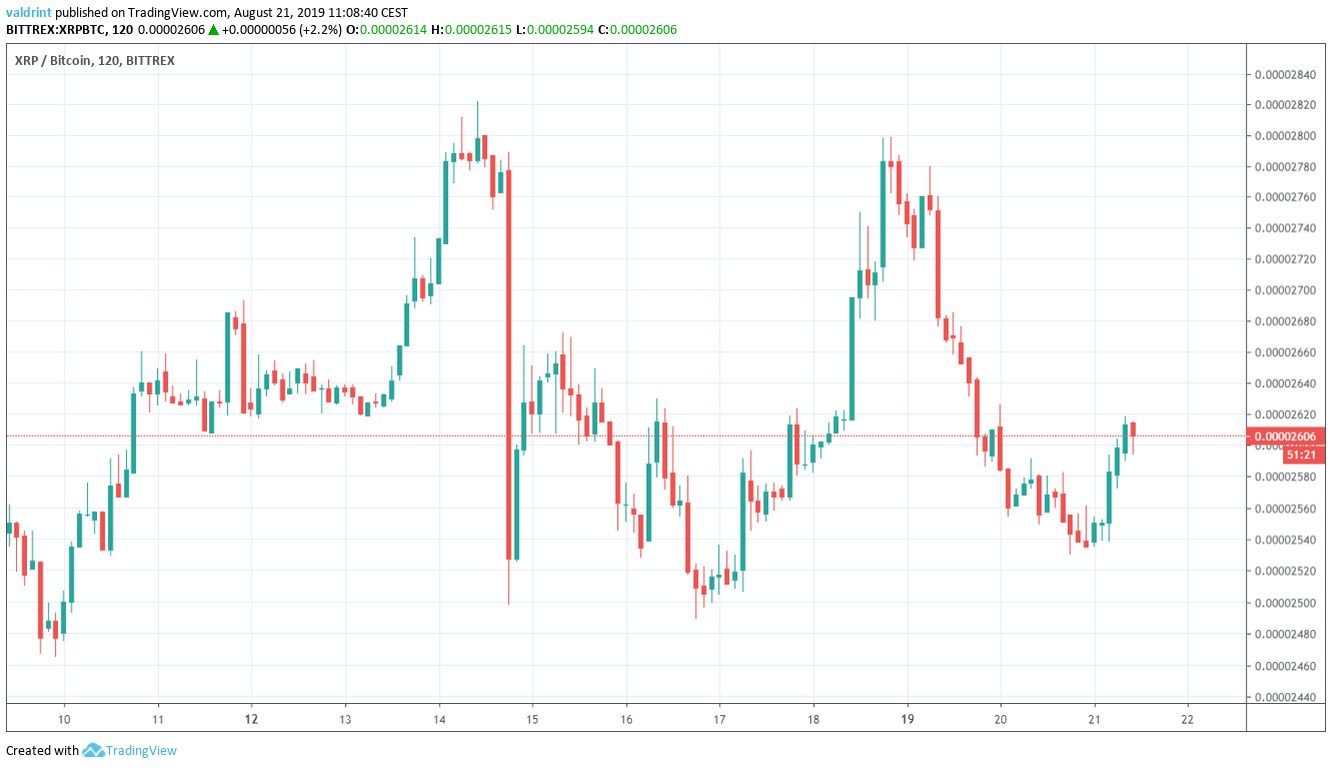
On August 10, 2019, the XRP price reached a low of 2470 satoshis. An upward followed and the altcoin reached a high of 2823 satoshis on August 14. After a brief downward movement, it reached similar highs on August 18. The price has been decreasing since.
Will the XRP price initiate a reversal or will the downward move continue? Keep reading below if you want to find out.
XRP Price: Trends and Highlights for August 21
XRP Price in an Ascending Triangle
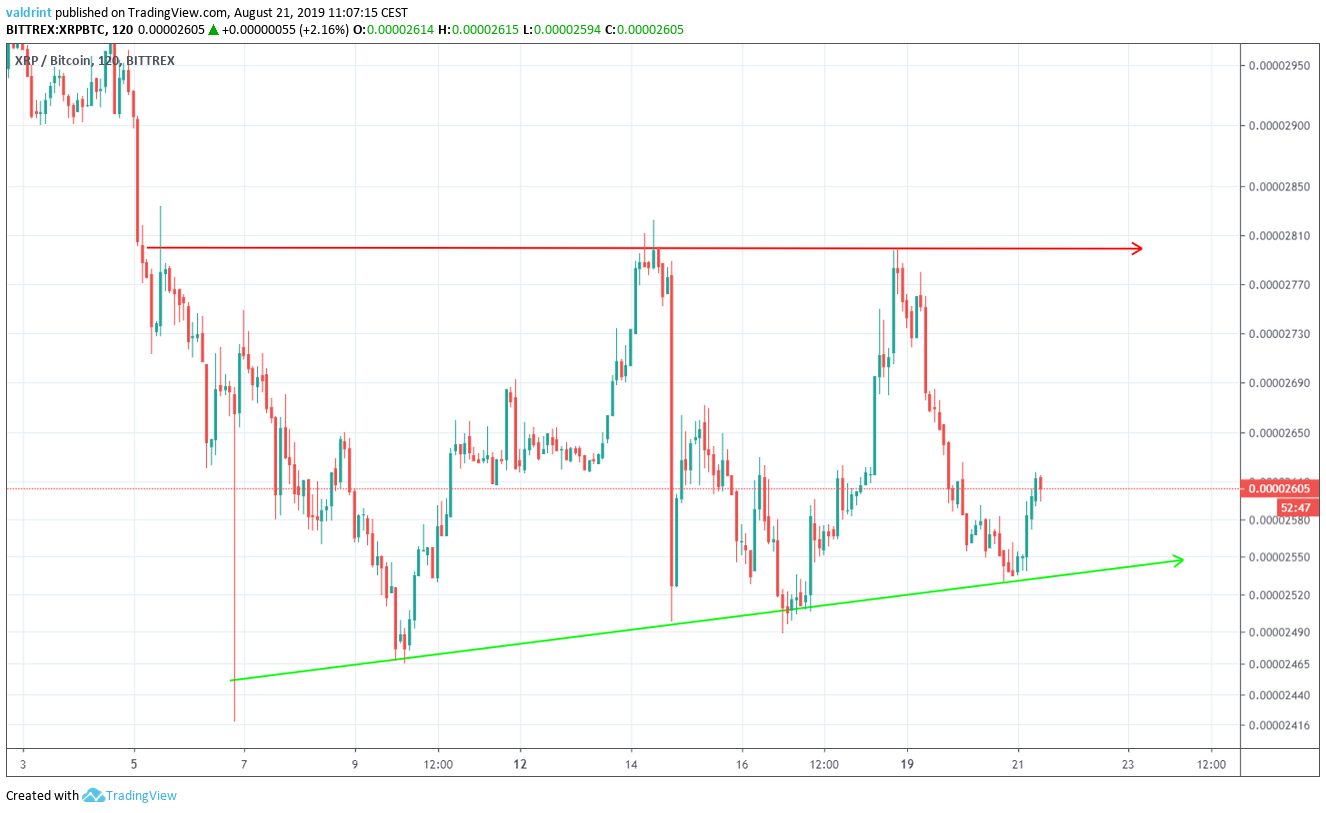
A closer look at price movement shows that XRP has been trading inside an ascending triangle since August 7.
Both the support and resistance lines have been validated several times — increasing the significance of the pattern.
At the time of writing, the XRP price was trading slightly above the support line.
A look at the moving averages (MA) supports a price increase towards the resistance line.
The 10- and 20-period MAs are very close to making a bullish cross.
After the previous instances of this happening, upward moves towards the resistance line have followed.
At the time of writing, this looks likely.
However, in order to predict whether a breakout is possible, we need to take a look at a long-term time-frame.
Long-Term
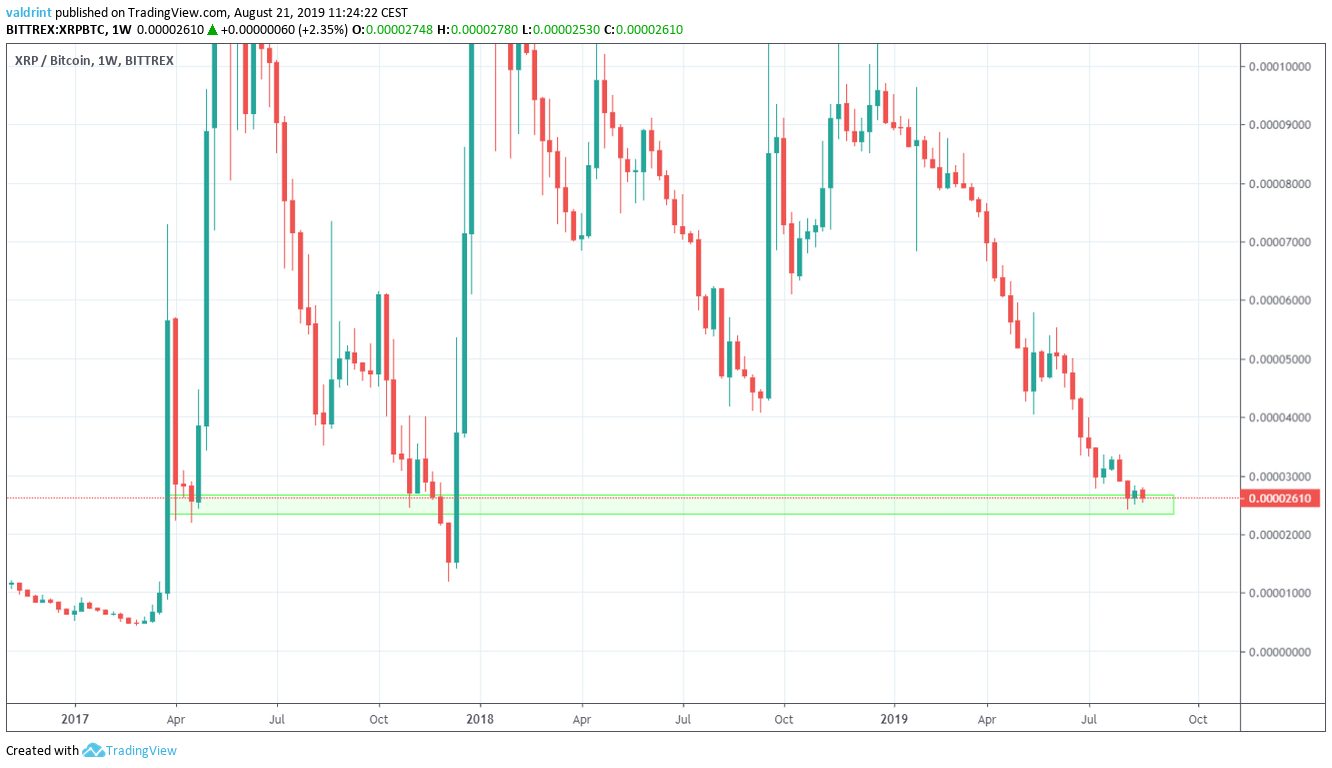
A look at the weekly time-frame shows that the XRP price is trading inside a very significant support area.
The area is found at 2500 satoshis.
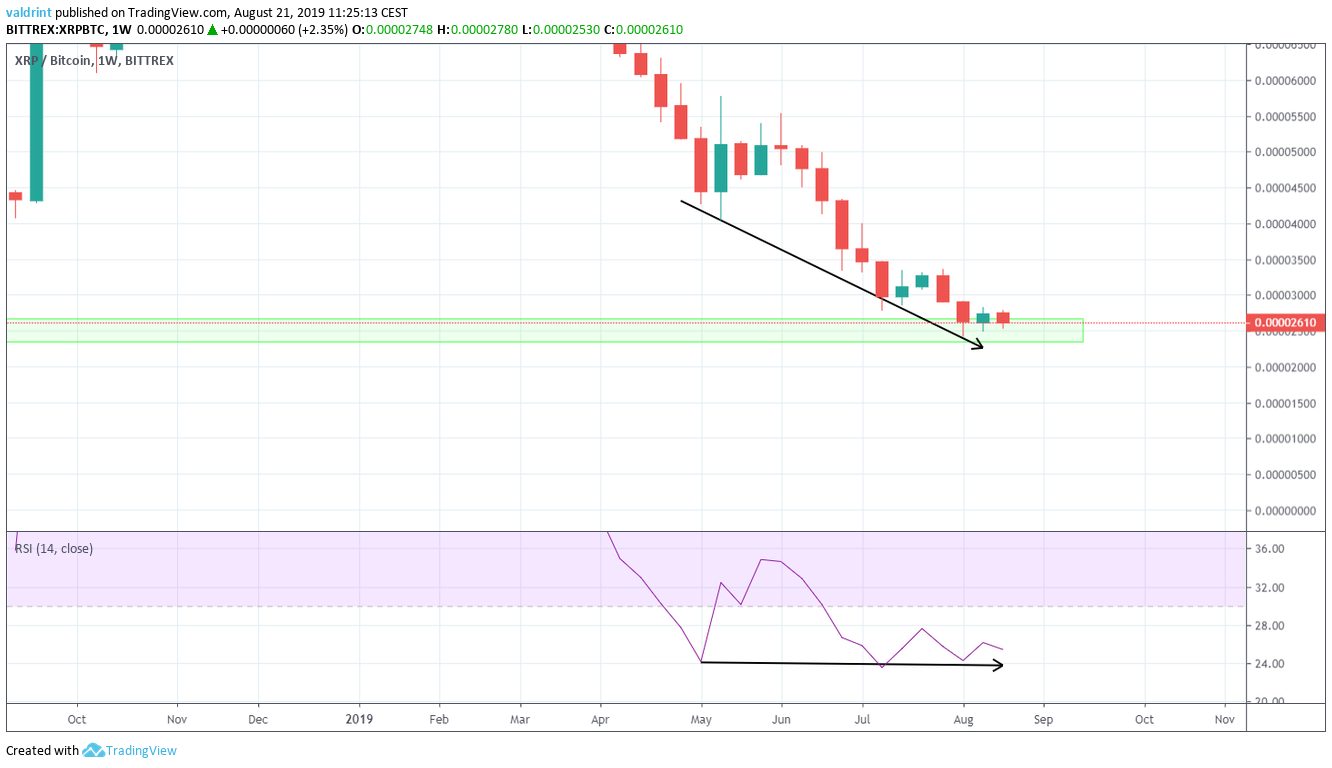
Additionally, we can see that the RSI has been generating bullish divergence since the beginning of May.
Divergence in the RSI in a weekly time-frame is uncommon and makes us believe that the XRP price will eventually begin an upward move.
This makes it likely that it will break out from the short-term triangle discussed in the first section.
Reversal Areas
In case XRP breaks out, one resistance area is outlined below.
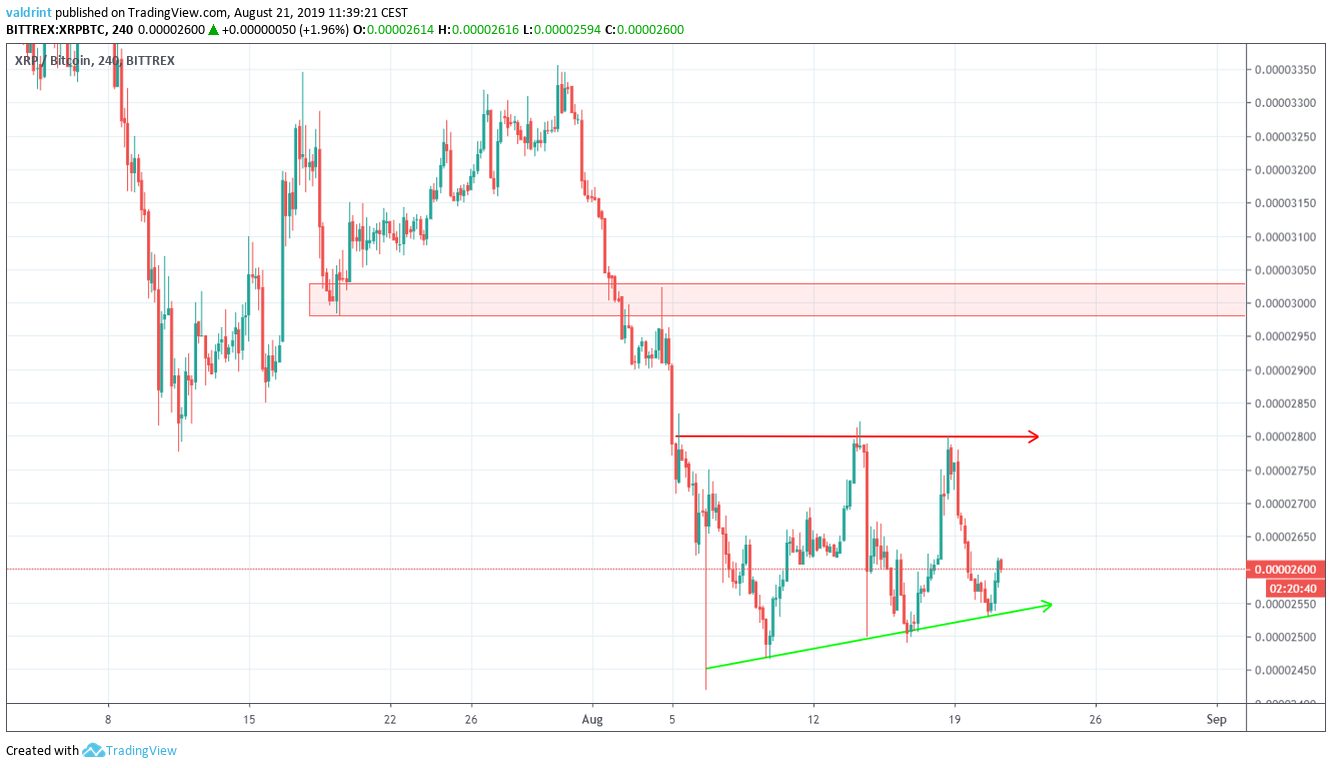
It is found at 3000 satoshis.
According to our analysis, the XRP price will eventually reach this area.
However, it is likely to continue trading inside the confines of the triangle for a period of time before ultimately breaking out.
XRP Price Summary
The XRP price is trading inside an ascending channel.
We believe that it is likely to reach the resistance line and eventually break out.
Due to the price being at a very significant support area, XRP/BTC looks like a potential buy and hold for a possible future upward move.
