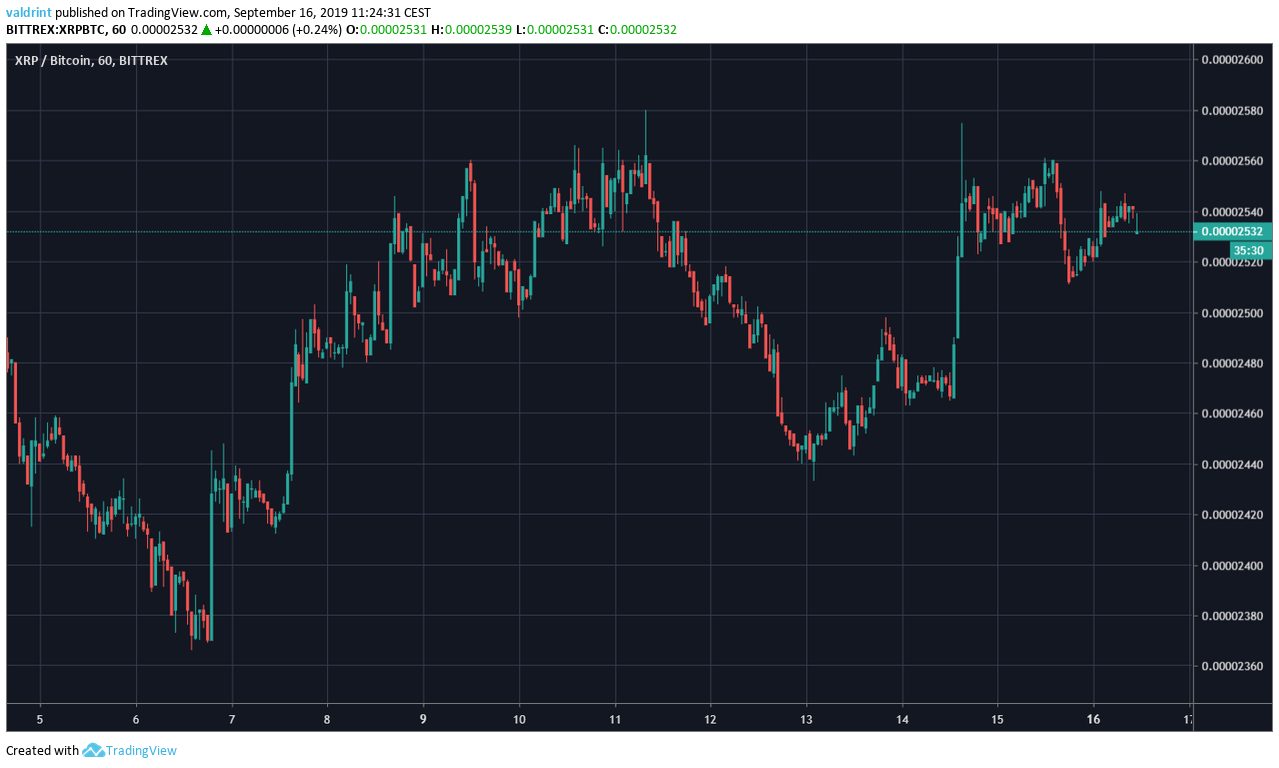
The XRP price has been increasing since September 6. The rally began with a low of 2366 satoshis and ended with a high of 2580 satoshis reached on September 11. After a brief decrease, the price reached similar highs on September 15.
Where will the XRP price go to next? Continue reading below if you want to find out.
XRP Price: Trends and Highlights for September 16
Resistance and Support
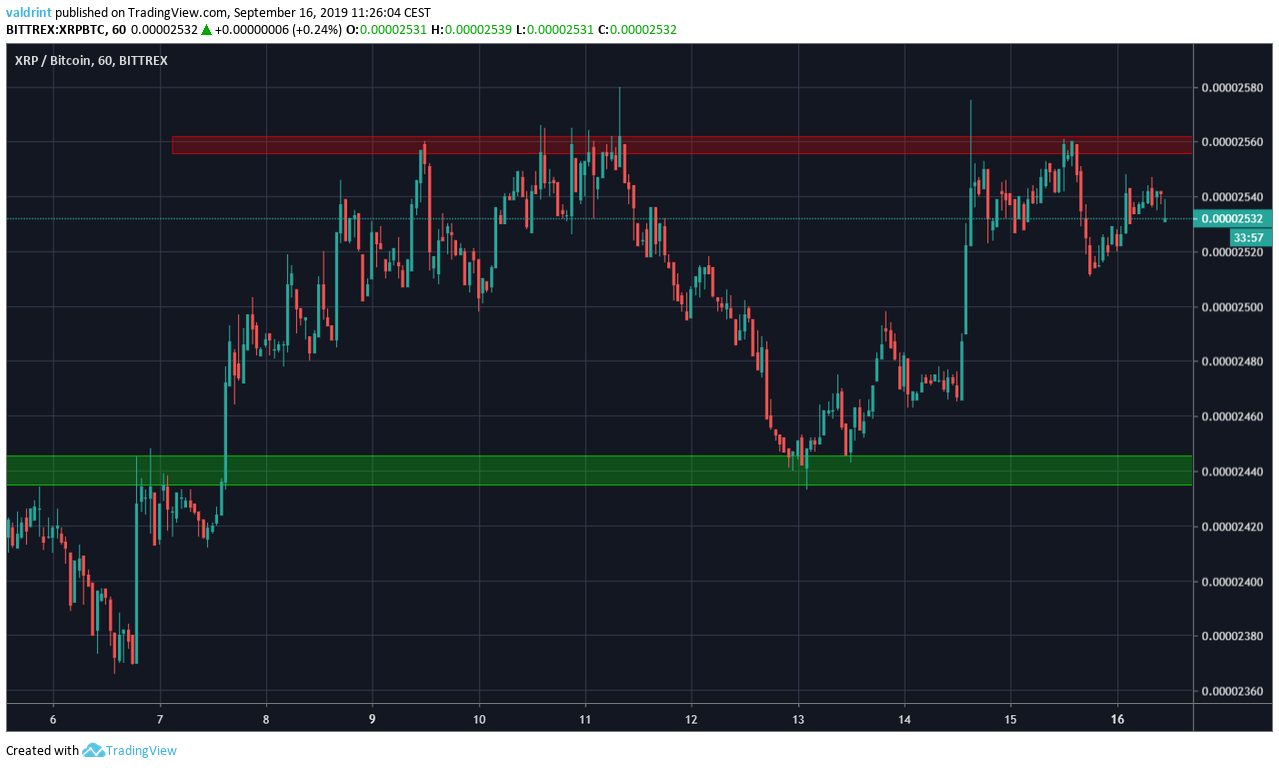
A look at the hourly time-frame gives us two reversal areas, one support and one resistance.
The support and resistance areas are found at 2440 and 2560 satoshis, respectively.
At the time of writing, the price was trading slightly below the resistance line, possibly trading inside a horizontal channel.
Where will it go next?
Beginning Of An Uptrend
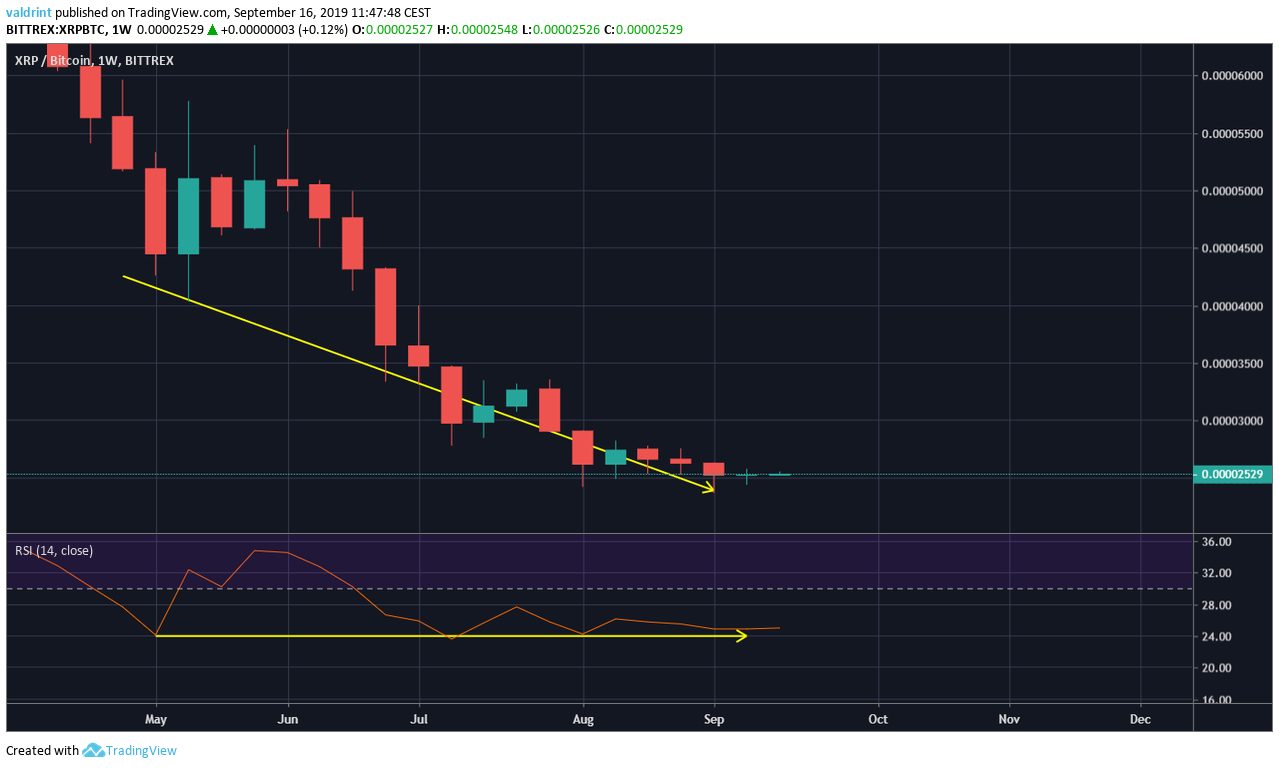
In order to determine whether XRP will begin an upward move, we will first use the weekly RSI.
It has been generating significant bullish divergence since the beginning of May.
Divergence in a weekly time-frame is not common. Therefore, it adds validity to the possibility that the price will begin an upward move.
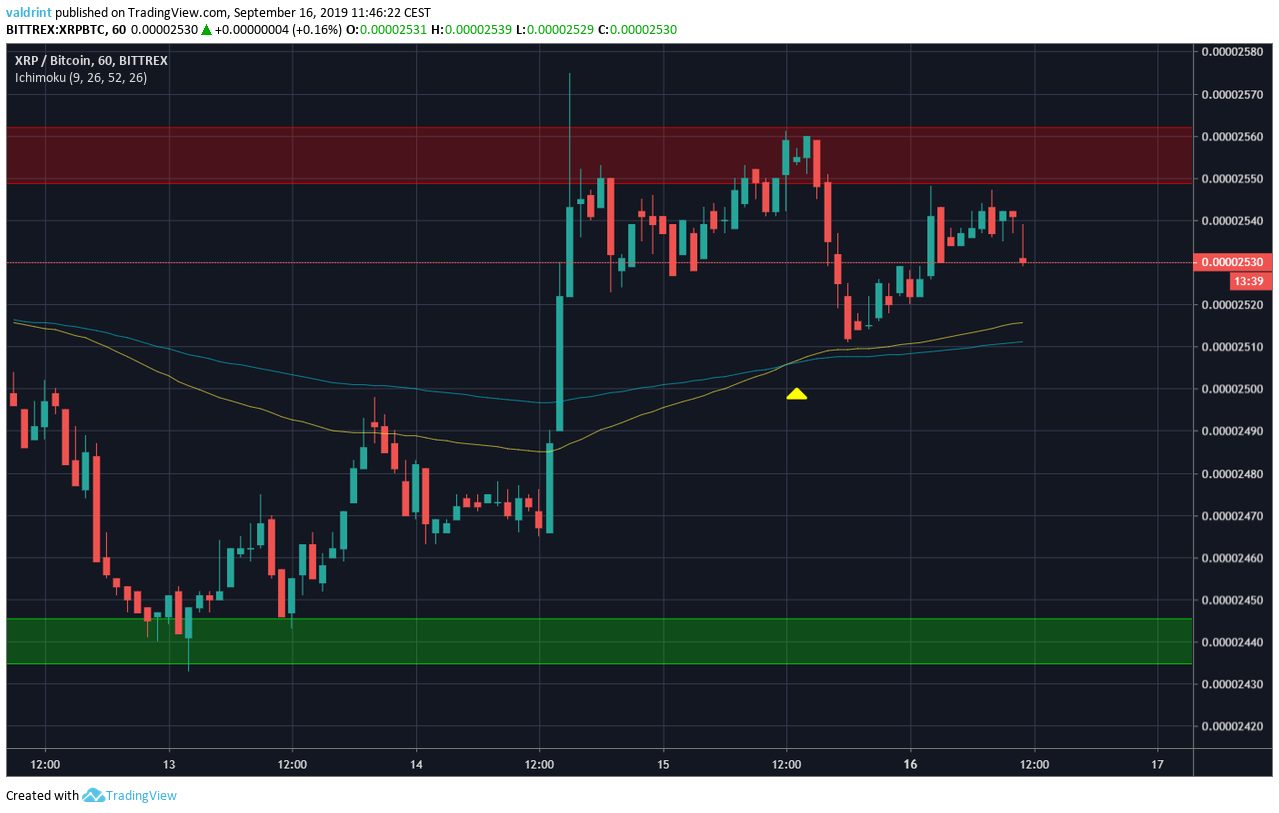
The 100- and 200-hour moving averages also suggest that further increases are in store.
They created a bullish cross on September 15.
The price has been trading above both of them since.
The combination of these indicators makes us believe that XRP is not yet done increasing.
Future Movement
An outline of possible future movement is given below.
Additionally, one more resistance area is traced.
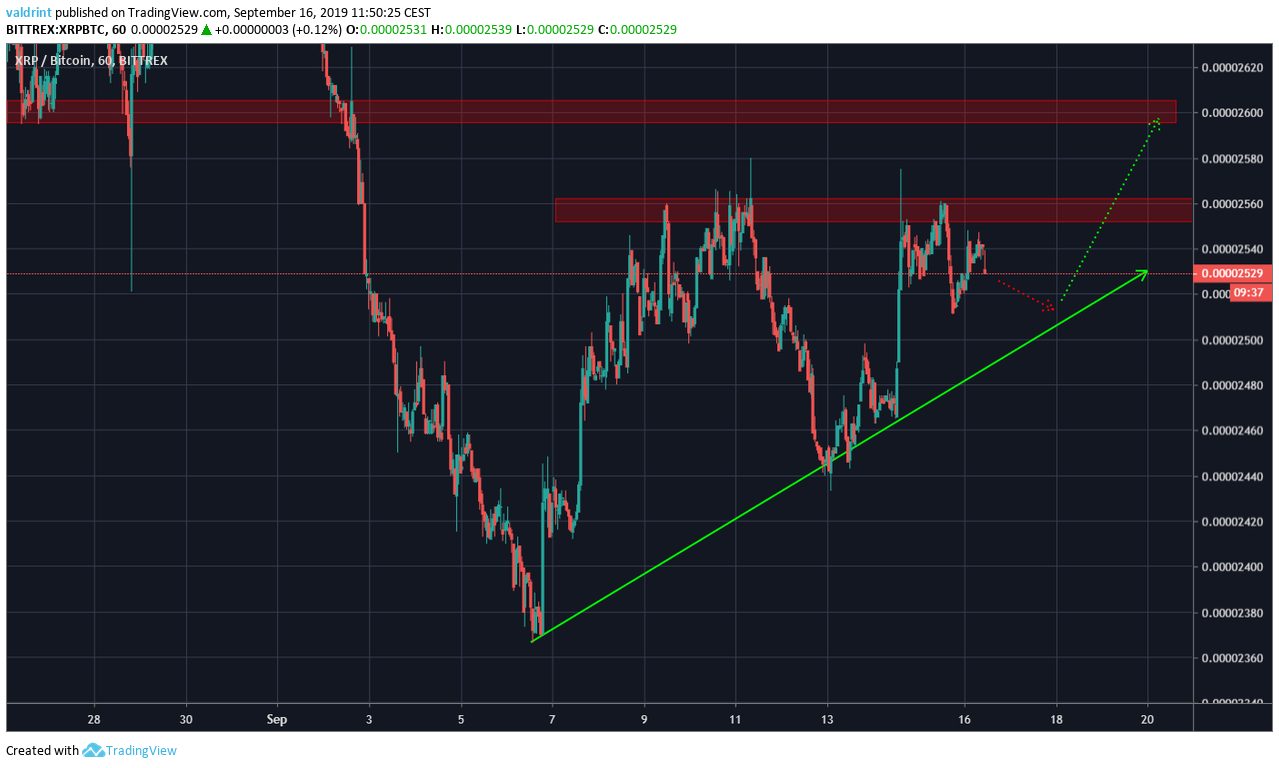
The XRP price is likely to undergo a short-term decrease, validating the ascending support line,.
Afterward, it should begin another upward move towards the second resistance area, which is found at 2600 satoshis.
XRP Price Summary
The XRP price is not following any clear trading patterns.
According to our analysis, it is likely to increase until it reaches the second resistance area.
For hypothetical trading purposes, even though we believe XRP will increase, the current price level does not allow for the initiation of a profitable long trade.
