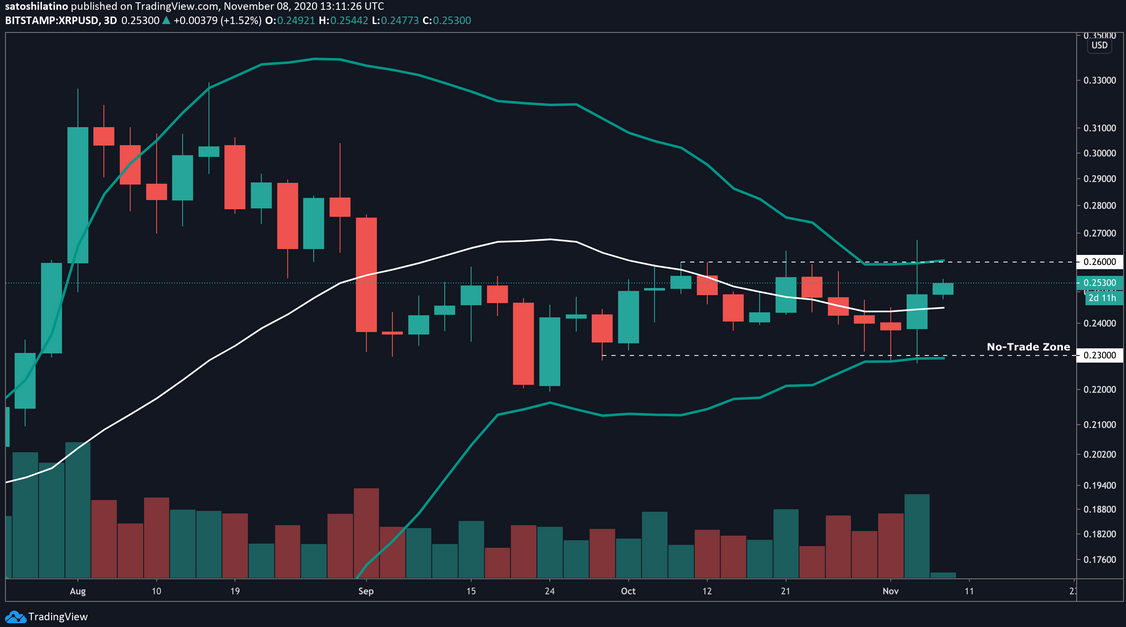
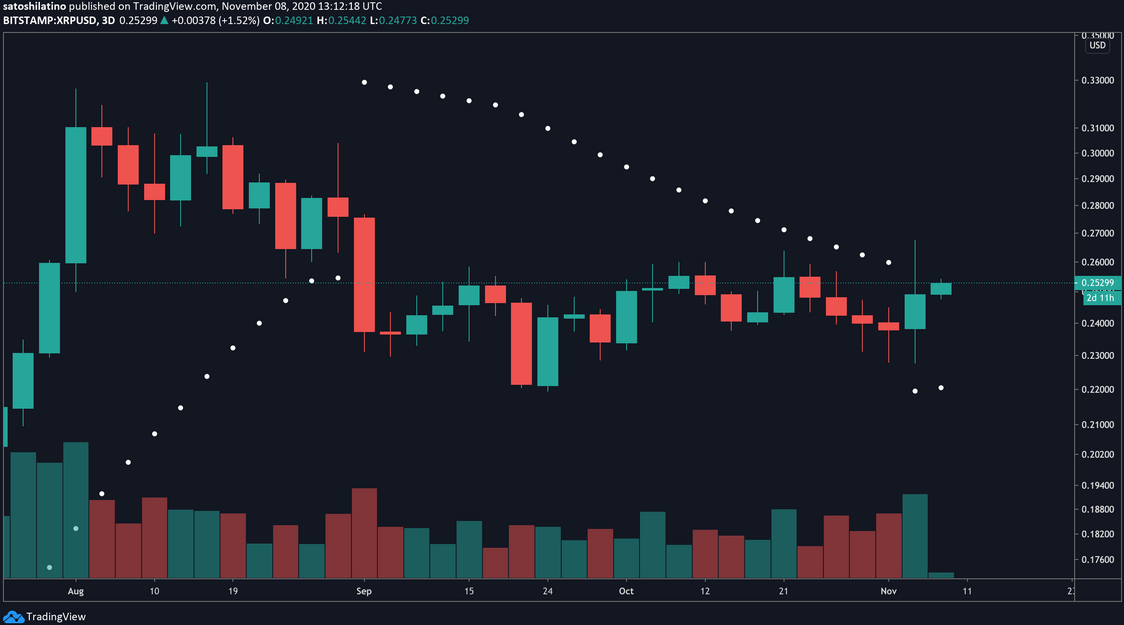
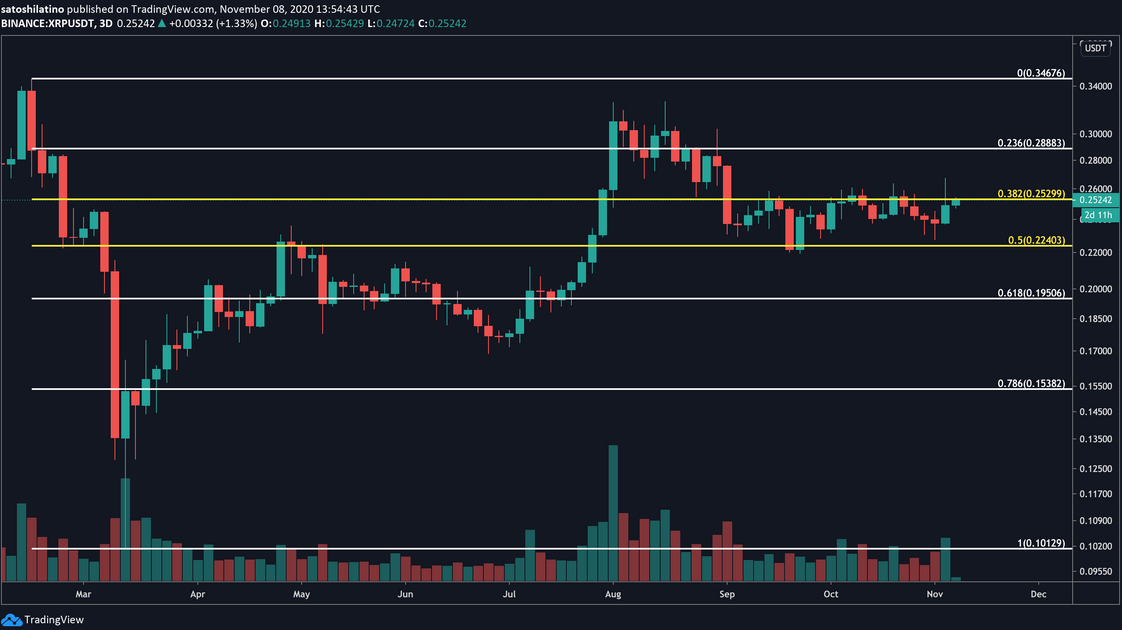
XRP's stagnation phase may soon be over as technicals turn bullish for the first time since late July. While Bitcoin has taken the lead in the latest bullish run-up, XRP has remained dormant. Now, a technical index suggests that this altcoin is on its way to greener pastures. XRP has gone through a month-long consolidation period that has forced the Bollinger bands to squeeze on its 3-day chart. Many analysts view squeezes as phases of stagnation that are often succeeded by high levels of volatility. The longer the contraction, the more violent the breakout that follows. This index’s inability to provide a clear path for the direction of the cross-border remittances token makes the area between the lower and upper band a reasonable no-trade zone. Breaking through the overhead resistance at $0.26 or the underlying support at $0.23 will determine where this altcoin is headed next. Despite the ambiguity that XRP presents, the parabolic stop and reverse metric, or “SAR,” favors the bulls. This trend-following indicator estimates that the downtrend that began on Aug. 4 reached exhaustion. As the stop and reversal points moved below XRP’s price on Nov. 5, the odds for a breakout increased drastically. Based on historical data, the stop and reversal system is highly effective in determining the course of XRP’s trend within the 3-day chart. The last two times the parabolic SAR flipped from bearish to bullish, the international settlement’s token rose by 61% and 30%, respectively. Now, a similar price action could be about to take place. By measuring the Fibonacci retracement indicator from February’s high of $0.35 to March’s low of $0.114, the $0.26 level is a critical resistance to pay attention to. Here, the 38.2% Fibonacci level converges with the upper Bollinger band, adding an extra layer of strength to this hurdle. Only a bullish impulse that allows XRP to turn the $0.26 barrier into support may see the token rise towards the 23.6% Fibonacci level at $0.29. On the flip side, a downswing that sends XRP underneath the $0.23 support may jeopardize the bullish outlook. Moving past this hurdle might see an increase in sell orders that pushes prices further down. If this were to happen, this altcoin could drop to the 61.8% Fibonacci level at $0.195 instead.Key Takeaways
XRP’s Downtrend Reaches Exhaustion


- English (UK)
- English (India)
- English (Canada)
- English (Australia)
- English (South Africa)
- English (Philippines)
- English (Nigeria)
- Deutsch
- Español (España)
- Español (México)
- Français
- Italiano
- Nederlands
- Polski
- Português (Portugal)
- Português (Brasil)
- Русский
- Türkçe
- العربية
- Ελληνικά
- Svenska
- Suomi
- עברית
- 日本語
- 한국어
- 简体中文
- 繁體中文
- Bahasa Indonesia
- Bahasa Melayu
- ไทย
- Tiếng Việt
- हिंदी
XRP Prepares To Breakout While Bulls Target $0.3
Published 11/09/2020, 12:15 AM
XRP Prepares To Breakout While Bulls Target $0.3
Latest comments
Loading next article…
Install Our App
Risk Disclosure: Trading in financial instruments and/or cryptocurrencies involves high risks including the risk of losing some, or all, of your investment amount, and may not be suitable for all investors. Prices of cryptocurrencies are extremely volatile and may be affected by external factors such as financial, regulatory or political events. Trading on margin increases the financial risks.
Before deciding to trade in financial instrument or cryptocurrencies you should be fully informed of the risks and costs associated with trading the financial markets, carefully consider your investment objectives, level of experience, and risk appetite, and seek professional advice where needed.
Fusion Media would like to remind you that the data contained in this website is not necessarily real-time nor accurate. The data and prices on the website are not necessarily provided by any market or exchange, but may be provided by market makers, and so prices may not be accurate and may differ from the actual price at any given market, meaning prices are indicative and not appropriate for trading purposes. Fusion Media and any provider of the data contained in this website will not accept liability for any loss or damage as a result of your trading, or your reliance on the information contained within this website.
It is prohibited to use, store, reproduce, display, modify, transmit or distribute the data contained in this website without the explicit prior written permission of Fusion Media and/or the data provider. All intellectual property rights are reserved by the providers and/or the exchange providing the data contained in this website.
Fusion Media may be compensated by the advertisers that appear on the website, based on your interaction with the advertisements or advertisers.
© 2007-2025 - Fusion Media Limited. All Rights Reserved.
