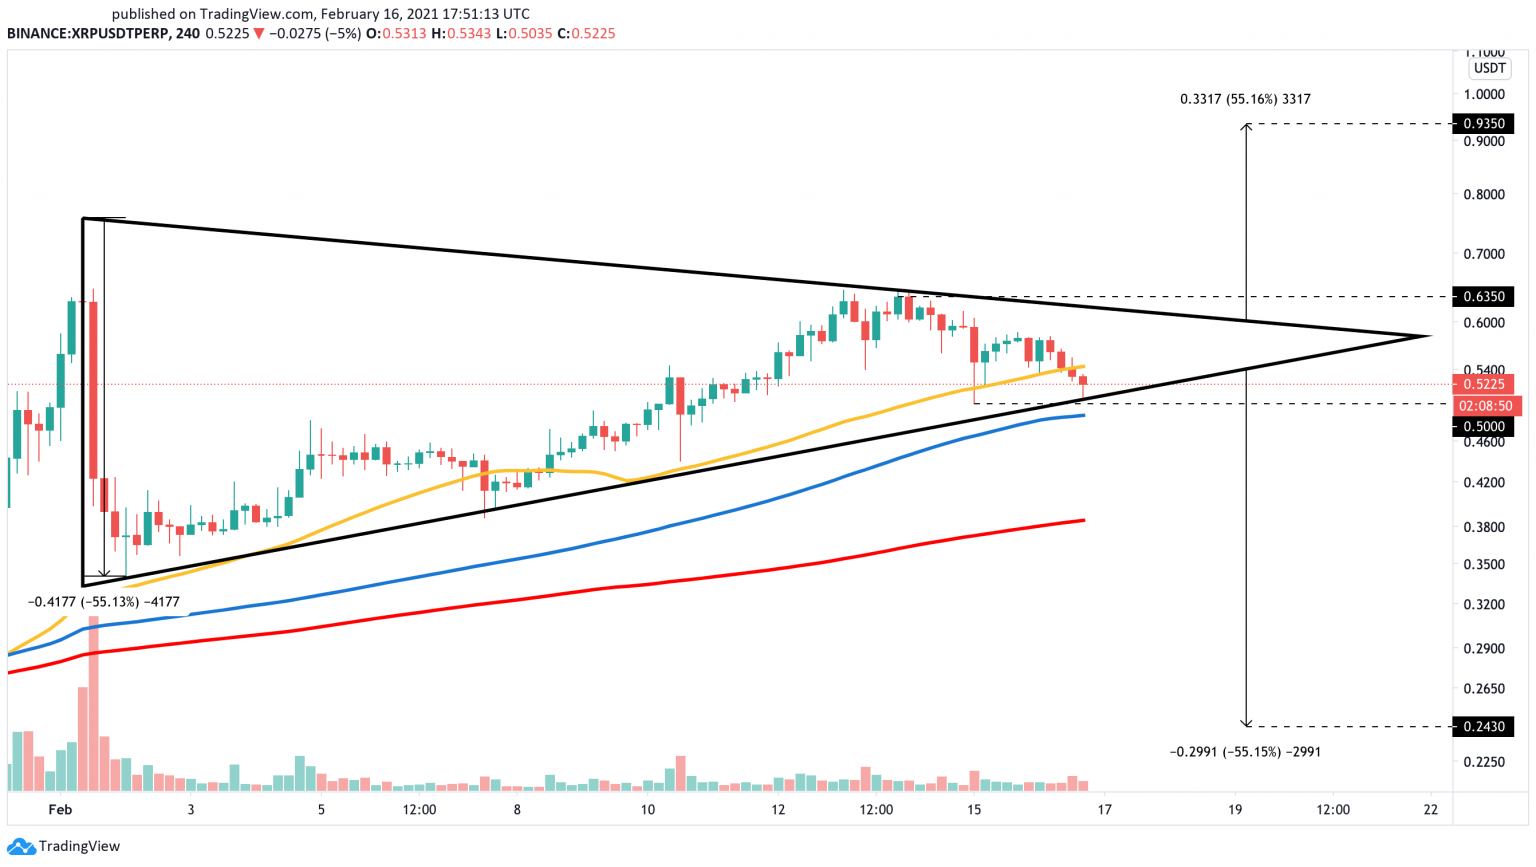
XRP remains stagnant as investors wait for a spike in volatility that allows them to determine where its price is heading next. XRP approaches a pivotal point in its trend that could see a breakout in either direction. XRP entered a consolidation phase after going through one of the most vicious pumps and dumps at the beginning of the month. Since then, this cryptocurrency has been making a series of lower highs and higher lows. Such market behavior led to the formation of a symmetrical triangle on the 4-hour chart. A descending trendline line can be drawn along with the swing highs, while a rising trendline developed along with the swing lows. As the sixth-largest cryptocurrency by market capitalization moves closer to the triangle’s apex, its price action has been contracting over time. The low volatility behind XRP helps identify two crucial price levels that will likely determine where it is headed next. A 4-hour candlestick close above $0.64 or below $0.50 would be followed by a 55% move in that direction. This target is determined by measuring the height of the triangle’s y-axis and adding it to the breakout point. Despite the ambiguity that XRP presents, its price currently sits on top of the 100 four-hour moving average. This lagging indicator adds an extra layer of support to the triangle’s lower trendline, which may contain any downward pressure. By bouncing off this critical support cluster, XRP will have a higher probability of retesting the $0.64 resistance and potentially break out towards $1.00. Nonetheless, a spike in selling pressure pushing XRP below underlying support at $0.50 will likely bring on a downswing to the 200 four-hour moving average at $0.39 or even the symmetrical triangle’s target of $0.24. Key Takeaways
XRP Prepares for High Volatility

- English (UK)
- English (India)
- English (Canada)
- English (Australia)
- English (South Africa)
- English (Philippines)
- English (Nigeria)
- Deutsch
- Español (España)
- Español (México)
- Français
- Italiano
- Nederlands
- Português (Portugal)
- Polski
- Português (Brasil)
- Русский
- Türkçe
- العربية
- Ελληνικά
- Svenska
- Suomi
- עברית
- 日本語
- 한국어
- 简体中文
- 繁體中文
- Bahasa Indonesia
- Bahasa Melayu
- ไทย
- Tiếng Việt
- हिंदी
XRP Poised For A 50% Move Defined By Two Crucial Price Levels
Published 02/17/2021, 12:37 AM
XRP Poised For A 50% Move Defined By Two Crucial Price Levels
Latest comments
Loading next article…
Install Our App
Risk Disclosure: Trading in financial instruments and/or cryptocurrencies involves high risks including the risk of losing some, or all, of your investment amount, and may not be suitable for all investors. Prices of cryptocurrencies are extremely volatile and may be affected by external factors such as financial, regulatory or political events. Trading on margin increases the financial risks.
Before deciding to trade in financial instrument or cryptocurrencies you should be fully informed of the risks and costs associated with trading the financial markets, carefully consider your investment objectives, level of experience, and risk appetite, and seek professional advice where needed.
Fusion Media would like to remind you that the data contained in this website is not necessarily real-time nor accurate. The data and prices on the website are not necessarily provided by any market or exchange, but may be provided by market makers, and so prices may not be accurate and may differ from the actual price at any given market, meaning prices are indicative and not appropriate for trading purposes. Fusion Media and any provider of the data contained in this website will not accept liability for any loss or damage as a result of your trading, or your reliance on the information contained within this website.
It is prohibited to use, store, reproduce, display, modify, transmit or distribute the data contained in this website without the explicit prior written permission of Fusion Media and/or the data provider. All intellectual property rights are reserved by the providers and/or the exchange providing the data contained in this website.
Fusion Media may be compensated by the advertisers that appear on the website, based on your interaction with the advertisements or advertisers.
© 2007-2025 - Fusion Media Limited. All Rights Reserved.
