As of Oct. 8, 2019, XRP is the third-largest cryptocurrency based on market capitalization. However, while most of the crypto market has been bullish in 2019, the current XRP price is lower than that on January 1.
On January 1, 2019, XRP was trading at $0.346. It is currently trading at $0.276, a decrease of roughly 20%.
However, the recent price movement for XRP indicates that an upward move might follow shortly.
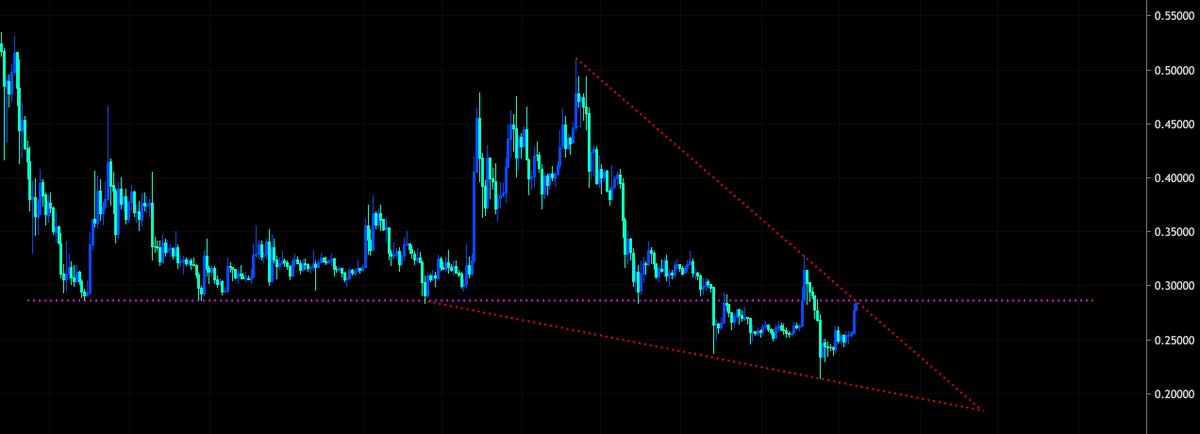
As blockchain enthusiast and investor @CryptoWelson stated, the XRP price has reached a significant resistance line.

XRP is trading right at the descending resistance line, which is part of the descending wedge which it has been trading in.
The descending wedge is a bullish pattern, making a price breakout more likely.
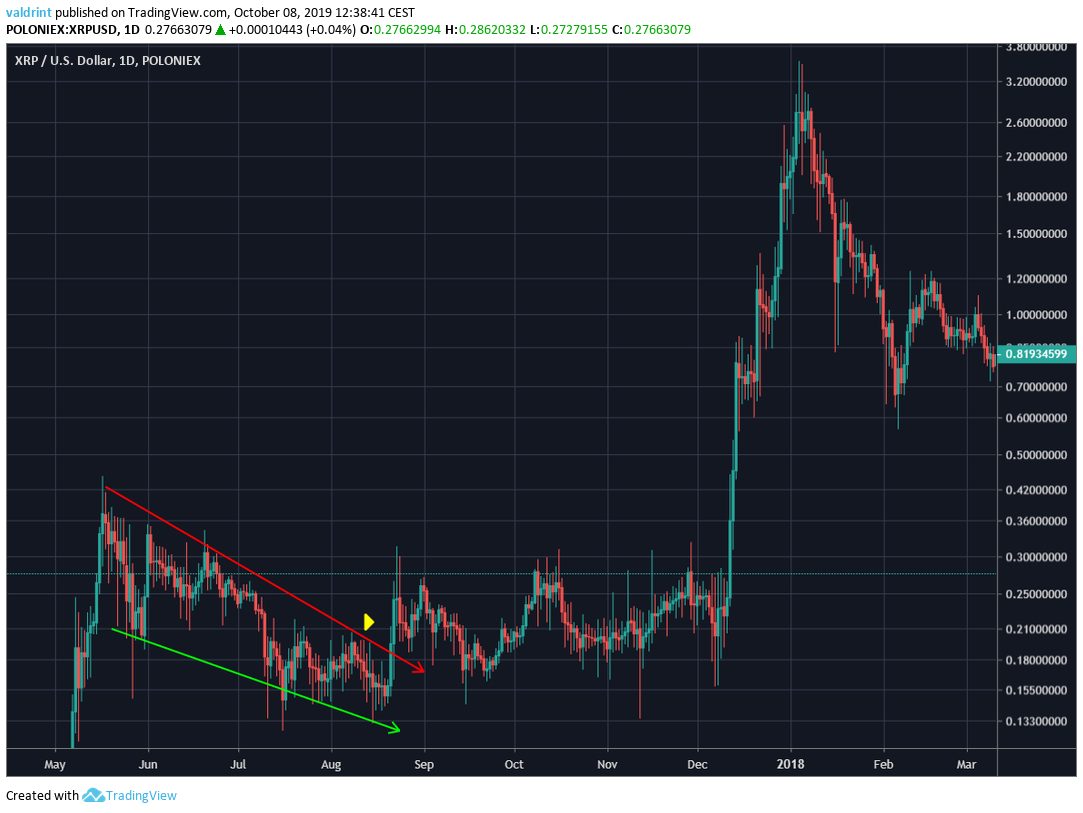
Additionally, @CryptoWelson stated that “this will be the most bullish sign XRP will have in the last 2 years.”

This refers to a very similar wedge breakout which transpired in August 2017 and eventually led to the $3.53 high on January 4.
Moving Averages
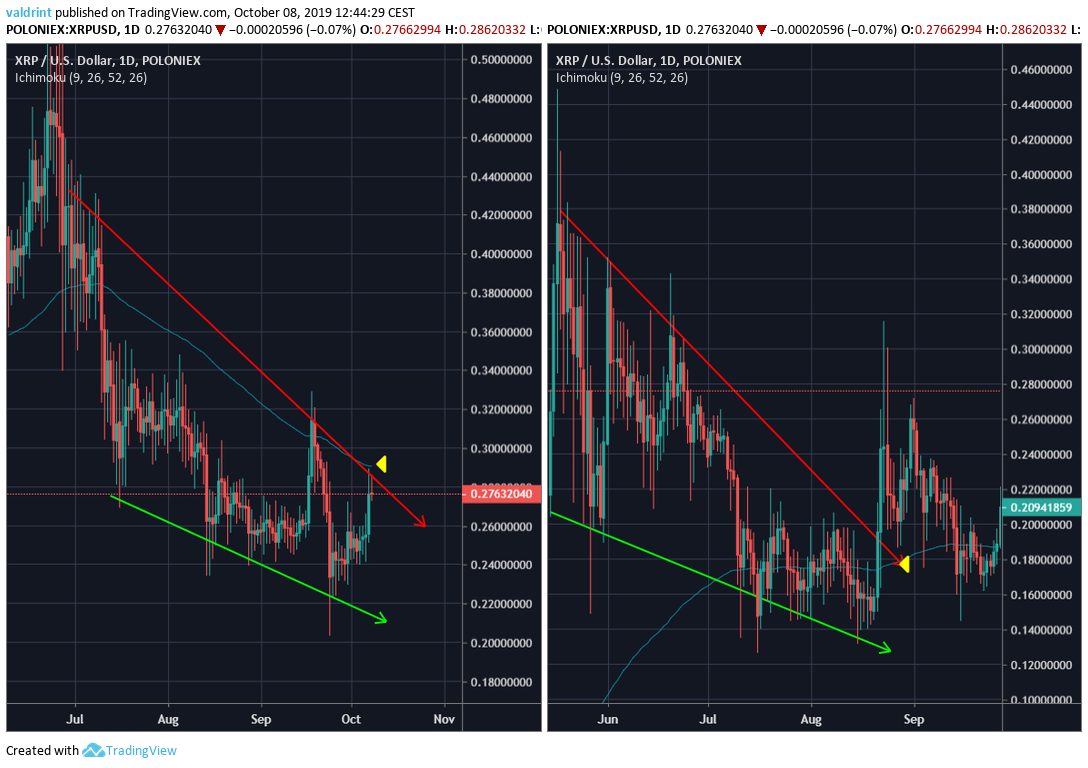
The strong resistance is reiterated by the 100-day moving average (MA).
The XRP price made a short-lived attempt at moving above it which was ultimately unsuccessful.
Interestingly, it was the same MA that offered resistance in a similar move in 2017.

Therefore, @cryptowelson is correct in pointing out the significance of the current resistance.
A movement above this level could very likely initiate a rapid movement similar to that in 2017.
