XOP: Should We Expect An Upside Breakout?

Published 02/23/2014, 11:12 PM
Updated 07/09/2023, 06:31 AM
MIND
-
XOP Chart

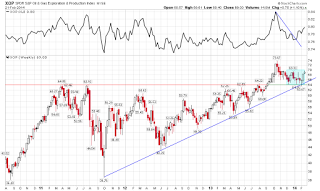
The underlying strength in the Energy sector, as well as the Exploration & Production industry, has caught my attention recently. The Oil & Gas Exploration & Production ETF (XOP) after hitting its all-time high in October 2013 retraced to the major support level at 64. Over the last three months the XOP has been consolidating within a rectangle pattern (light blue) just above the major support. The rising trendline from the bottom in October 2011 provided the additional support and the price reached to the upper limits of the consolidation pattern. Note that XOP started to outperform the Energy Sector ETF (XLE).
SPDR Chart
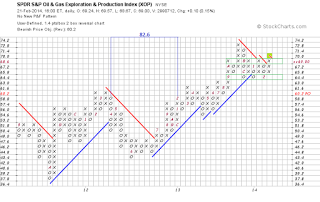
The intermediate horizon P&F chart shows that a breakout from the 64-69 congestion area would trigger a buy signal (lime box) at 70 and establish a new horizontal count with the potential target at 81.2. It would be in close proximity to the horizontal count target from the bottom of 2012 at 82.6. Keep in mind that the 82 level is an intermediate-term target and may be months away. I would keep my eye on the recent highs at 73 first.
Oil & Gas Seasonality Chart
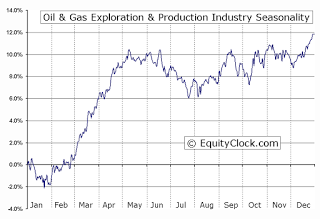
The seasonality chart, courtesy of equityclock.com, shows that the Exploration & Production industry enters the most favorable period in March-April. We might expect the upside breakout from the three-month consolidation on the XOP chart.

Latest comments

Loading next article…
Risk Disclosure: Trading in financial instruments and/or cryptocurrencies involves high risks including the risk of losing some, or all, of your investment amount, and may not be suitable for all investors. Prices of cryptocurrencies are extremely volatile and may be affected by external factors such as financial, regulatory or political events. Trading on margin increases the financial risks.
Before deciding to trade in financial instrument or cryptocurrencies you should be fully informed of the risks and costs associated with trading the financial markets, carefully consider your investment objectives, level of experience, and risk appetite, and seek professional advice where needed.
Fusion Media would like to remind you that the data contained in this website is not necessarily real-time nor accurate. The data and prices on the website are not necessarily provided by any market or exchange, but may be provided by market makers, and so prices may not be accurate and may differ from the actual price at any given market, meaning prices are indicative and not appropriate for trading purposes. Fusion Media and any provider of the data contained in this website will not accept liability for any loss or damage as a result of your trading, or your reliance on the information contained within this website.
It is prohibited to use, store, reproduce, display, modify, transmit or distribute the data contained in this website without the explicit prior written permission of Fusion Media and/or the data provider. All intellectual property rights are reserved by the providers and/or the exchange providing the data contained in this website.
Fusion Media may be compensated by the advertisers that appear on the website, based on your interaction with the advertisements or advertisers.
© 2007-2025 - Fusion Media Limited. All Rights Reserved.