
A couple of weeks ago I looked at a technical pattern which had been formed on the Oil Services ETF (OIH) chart and wrote about bullish implications this pattern could have. Since then OIH gained 5% and the Energy sector remains the best performing market sector starting from June when the S&P 500 printed the interim low.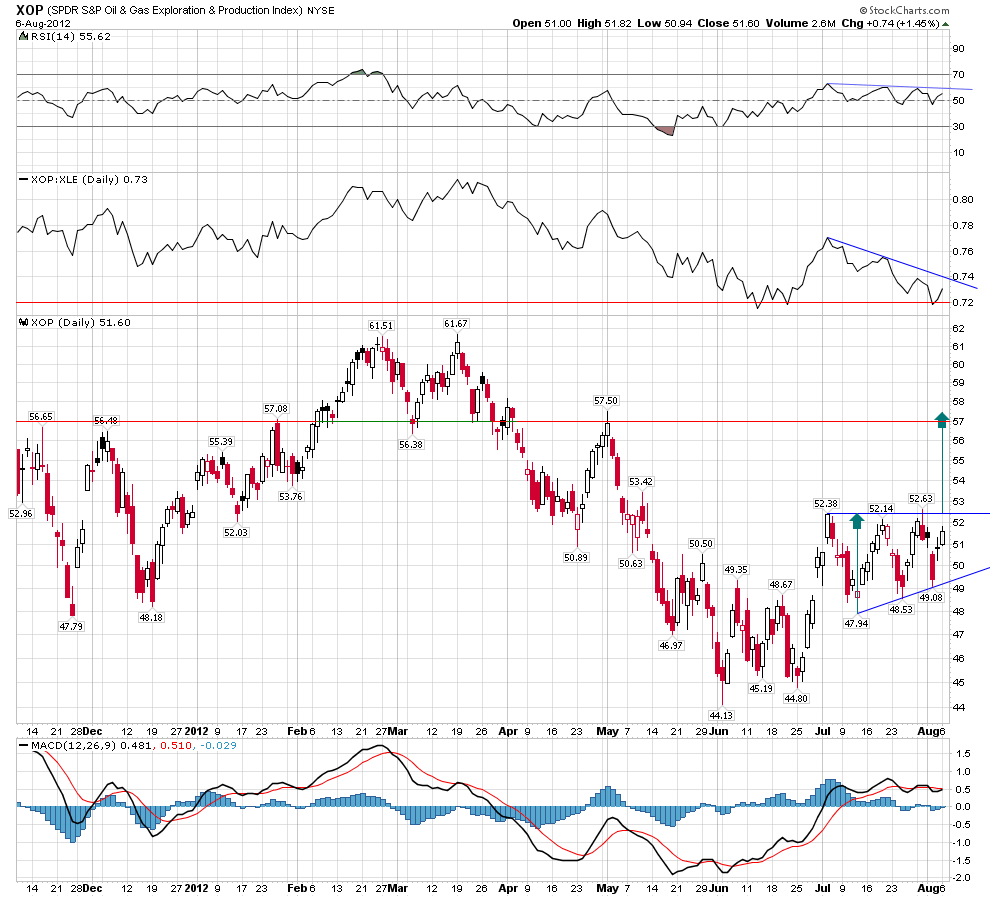
One of the Energy ETFs family - the Oil & Gas Exploration & Production ETF (XOP) – is trading within a range over the last month and lagging the Energy sector ETF (XLE). The XOP:XLE ratio reached one of the lowest readings since 2010 (the upper indicator window). Rising Oil prices will most likely help XOP to start outperforming XLE again.
Meanwhile, XOP is forming an Ascending Triangle on the daily chart with the price objective around 57 in case of the upward breakout. RSI should break through its declining trendline as a confirmation of the price breakout out of the Ascending Triangle.A couple of weeks ago I looked at a technical pattern which had been formed on the Oil Services ETF (OIH) chart and wrote about bullish implications this pattern could have. Since then OIH gained 5% and the Energy sector remains the best performing market sector starting from June when the S&P 500 printed the interim low. 
On the short-term P&F chart the price reversed its short-term downtrend in July and issued a Triple Top buy signal (green box). Immediately after that the price pulled back into the pattern but didn't issue a new sell signal thus building a foundation for a stronger Bullish Catapult pattern. This pattern will be formed if the price reaches 53. With a break below 49.5 a reassessment of this short-term consolidation pattern will be needed. The vertical count from the June low points to 58 as a potential price target.
On the intermediate-term P&F chart we see that the descending Bearish Resistance line is breached. However, there is still no a new buy signal confirming this breakout. An extension of the last column of Xs to 53 will give a Triple Top buy signal and validate the trend reversal. The vertical count from the June low gives a price objective at 57. More significance to this level is given by the fact that it's the level of strong previous resistance.
Disclaimer: I express only my personal opinion on the market and do not provide any trading or financial advice (see Disclaimer on my site).
- English (UK)
- English (India)
- English (Canada)
- English (Australia)
- English (South Africa)
- English (Philippines)
- English (Nigeria)
- Deutsch
- Español (España)
- Español (México)
- Français
- Italiano
- Nederlands
- Português (Portugal)
- Polski
- Português (Brasil)
- Русский
- Türkçe
- العربية
- Ελληνικά
- Svenska
- Suomi
- עברית
- 日本語
- 한국어
- 简体中文
- 繁體中文
- Bahasa Indonesia
- Bahasa Melayu
- ไทย
- Tiếng Việt
- हिंदी
XOP Is Taking A Break
Latest comments
Loading next article…
Install Our App
Risk Disclosure: Trading in financial instruments and/or cryptocurrencies involves high risks including the risk of losing some, or all, of your investment amount, and may not be suitable for all investors. Prices of cryptocurrencies are extremely volatile and may be affected by external factors such as financial, regulatory or political events. Trading on margin increases the financial risks.
Before deciding to trade in financial instrument or cryptocurrencies you should be fully informed of the risks and costs associated with trading the financial markets, carefully consider your investment objectives, level of experience, and risk appetite, and seek professional advice where needed.
Fusion Media would like to remind you that the data contained in this website is not necessarily real-time nor accurate. The data and prices on the website are not necessarily provided by any market or exchange, but may be provided by market makers, and so prices may not be accurate and may differ from the actual price at any given market, meaning prices are indicative and not appropriate for trading purposes. Fusion Media and any provider of the data contained in this website will not accept liability for any loss or damage as a result of your trading, or your reliance on the information contained within this website.
It is prohibited to use, store, reproduce, display, modify, transmit or distribute the data contained in this website without the explicit prior written permission of Fusion Media and/or the data provider. All intellectual property rights are reserved by the providers and/or the exchange providing the data contained in this website.
Fusion Media may be compensated by the advertisers that appear on the website, based on your interaction with the advertisements or advertisers.
© 2007-2025 - Fusion Media Limited. All Rights Reserved.