Analysis for TOP-3 anonymous cryptocurrencies: forecast for Dash, Zcash, Monero with all-round market view applied.In this post, I applied the following tools: all-round market view, graphic analysis, market balance level, oscillators, volume profile, trendline analysis, Japanese candlestick patterns.
Those, who are interested in private coins, will especially like this article. I haven’t compared Zcash, Dash and Monero for ages.
Today, I’d like to update trading scenarios for them and give an overall assessment of the anonymous coin segment. If you look at the market of confidential cryptocurrencies, the situation is like this (see the chart below).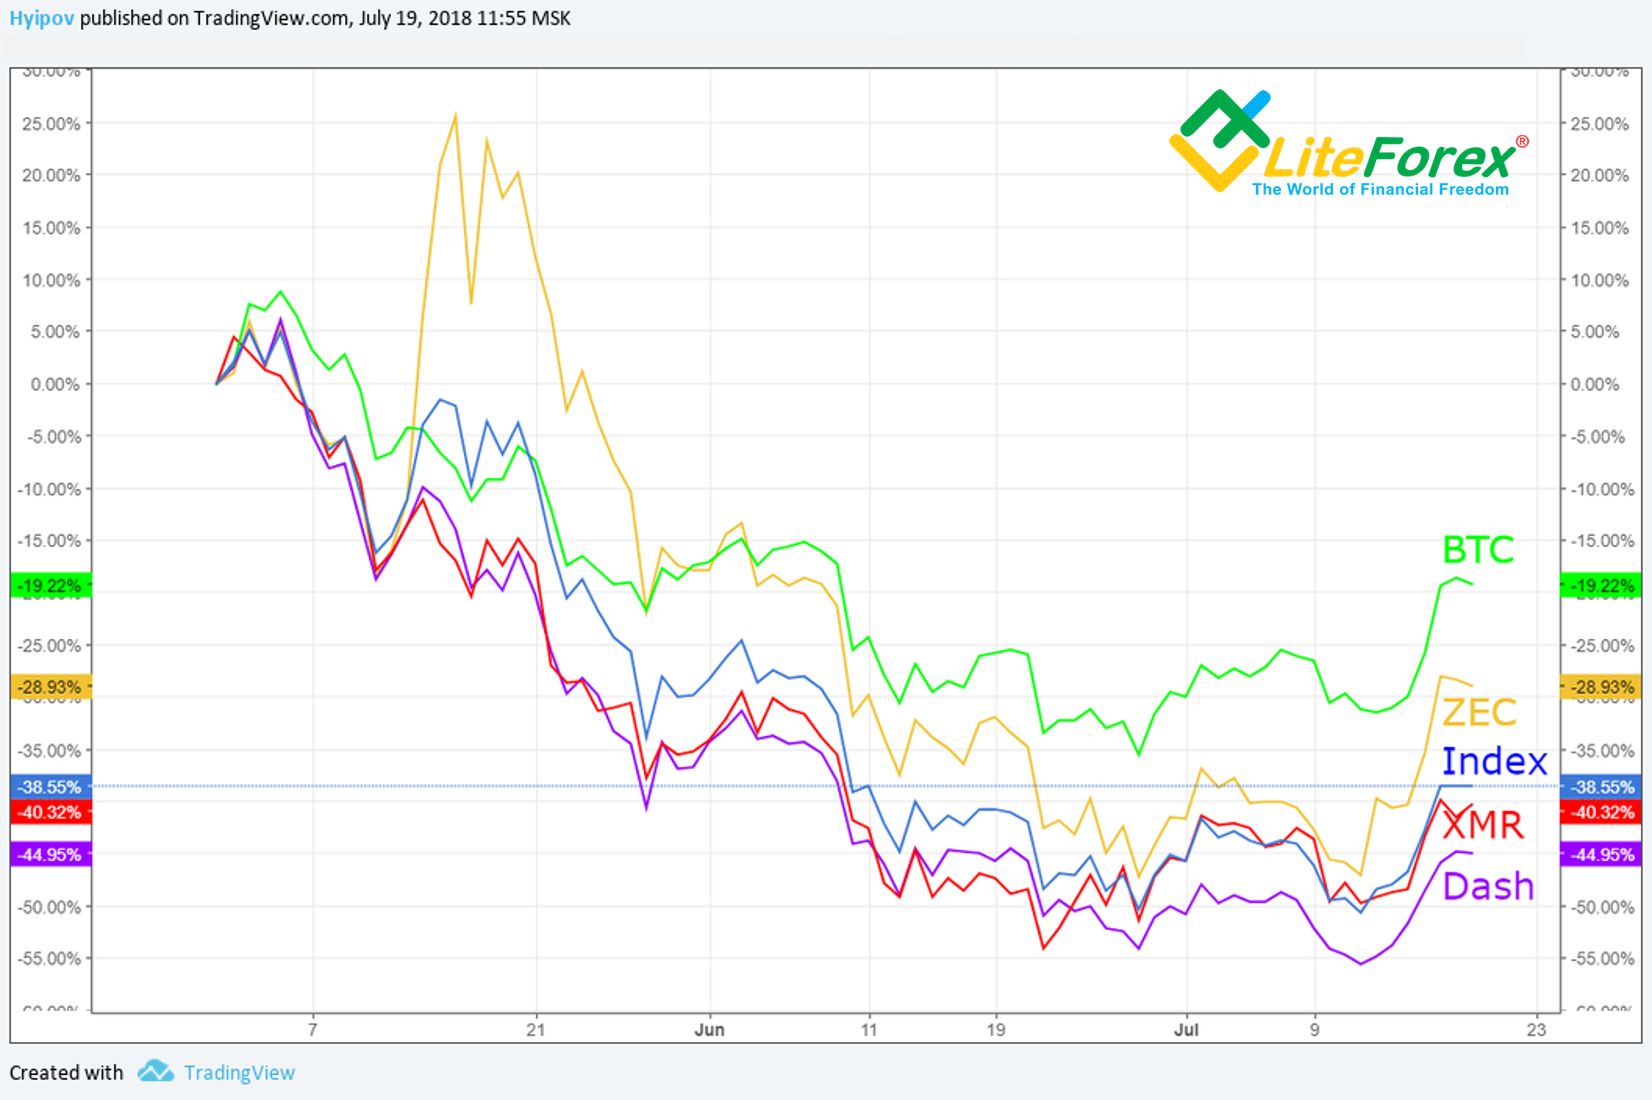
In general, the Index of anonymous assets is lower than Bitcoin quotes, and so, below the conditional market index. However, the situation for each coin is different, as it is clear from the chart.
Zcash (yellow ticker) is above the index. Monero (red line) is closely following, and Dash (purple line) is performing worse than the composite index of anonymous coins together.
Let’s conduct a short analysis for each coin and find out their current state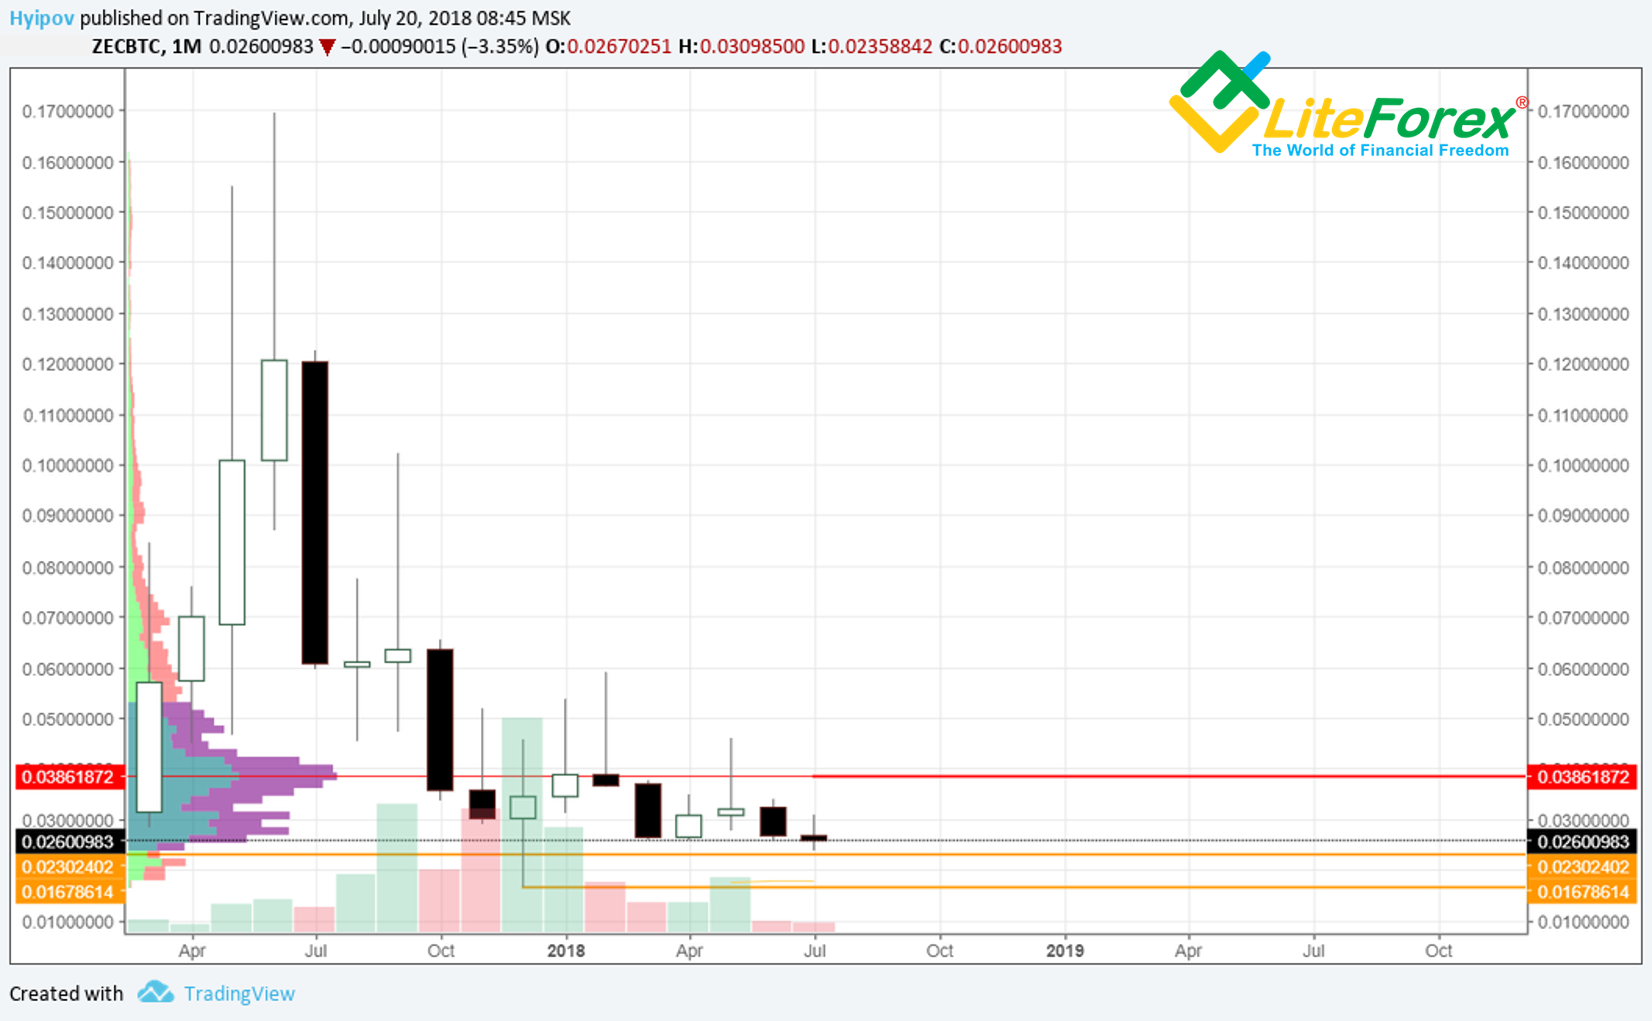
It is clear that Zcash is close to the key level of 0.023 BTC (low of February, 2017). This level was once broken through in December, 2017, so its strength is not so obvious now. However, combined with the December low, the zone between 00.23 and 0.016 is the strong support zone.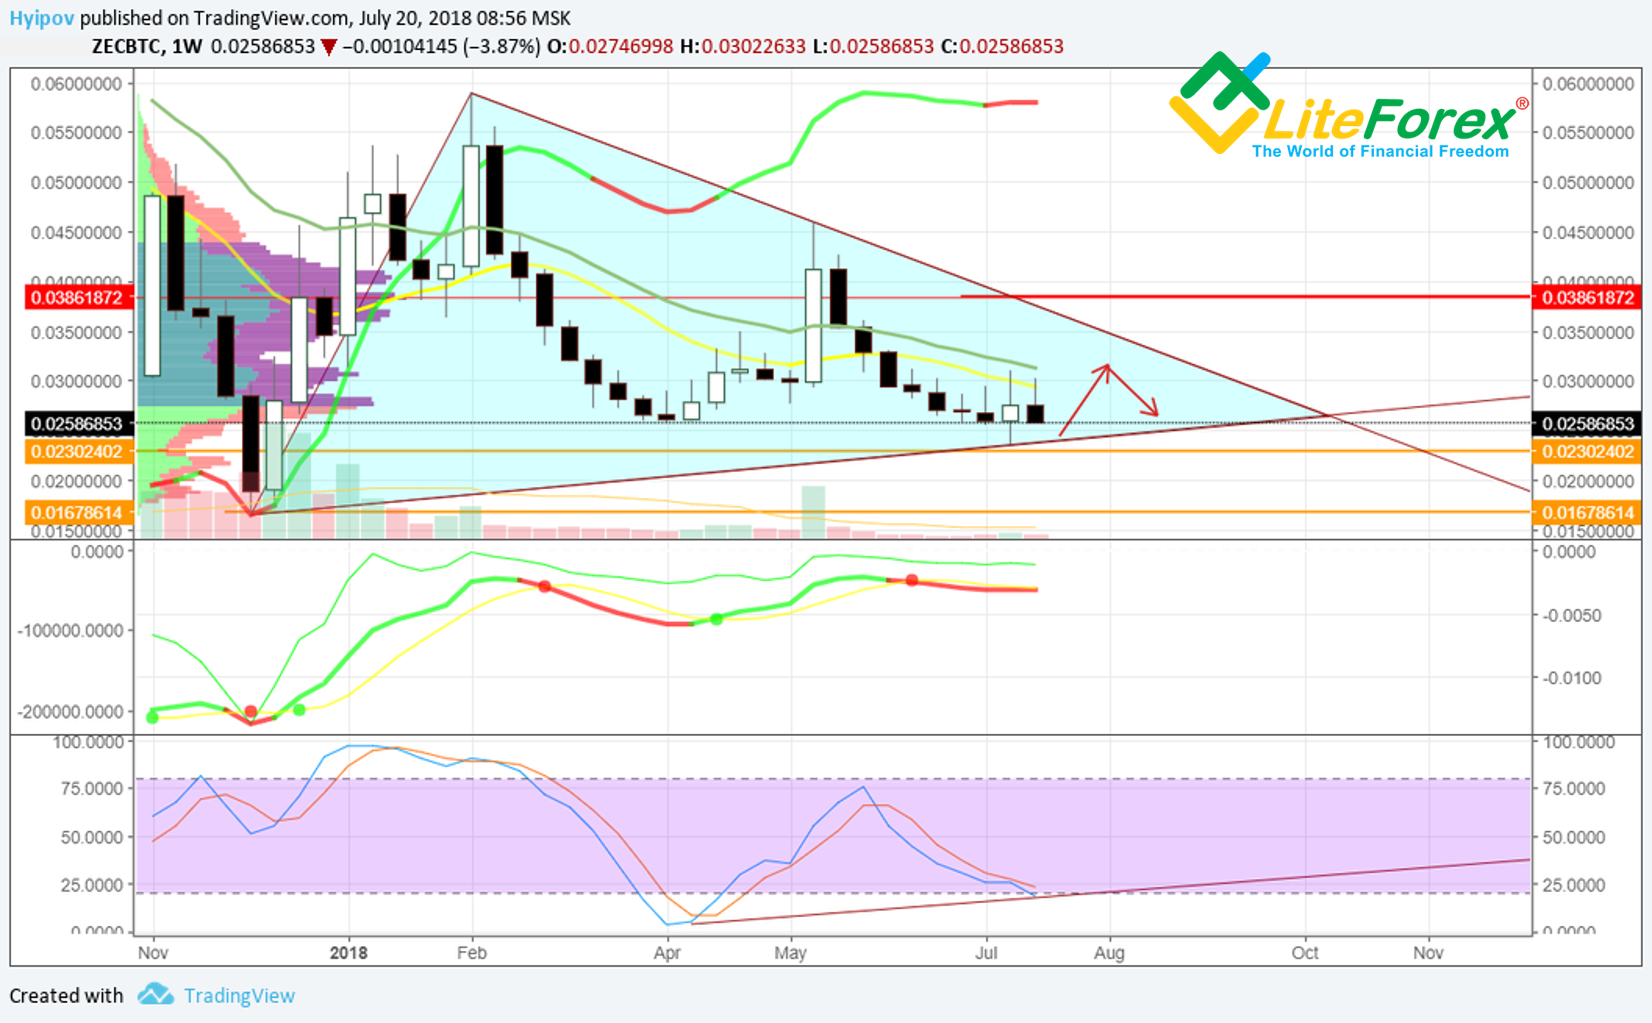
It is clear from ZEC 1W chart that it is in global consolidation with a bottom support at around 0.023. MACD and RSI stochastic feature bullish convergences, but MACD moving averages at the top window border hinder bullish trend, so, the ZEC price is likely to be moving inside the triangle until at least late August.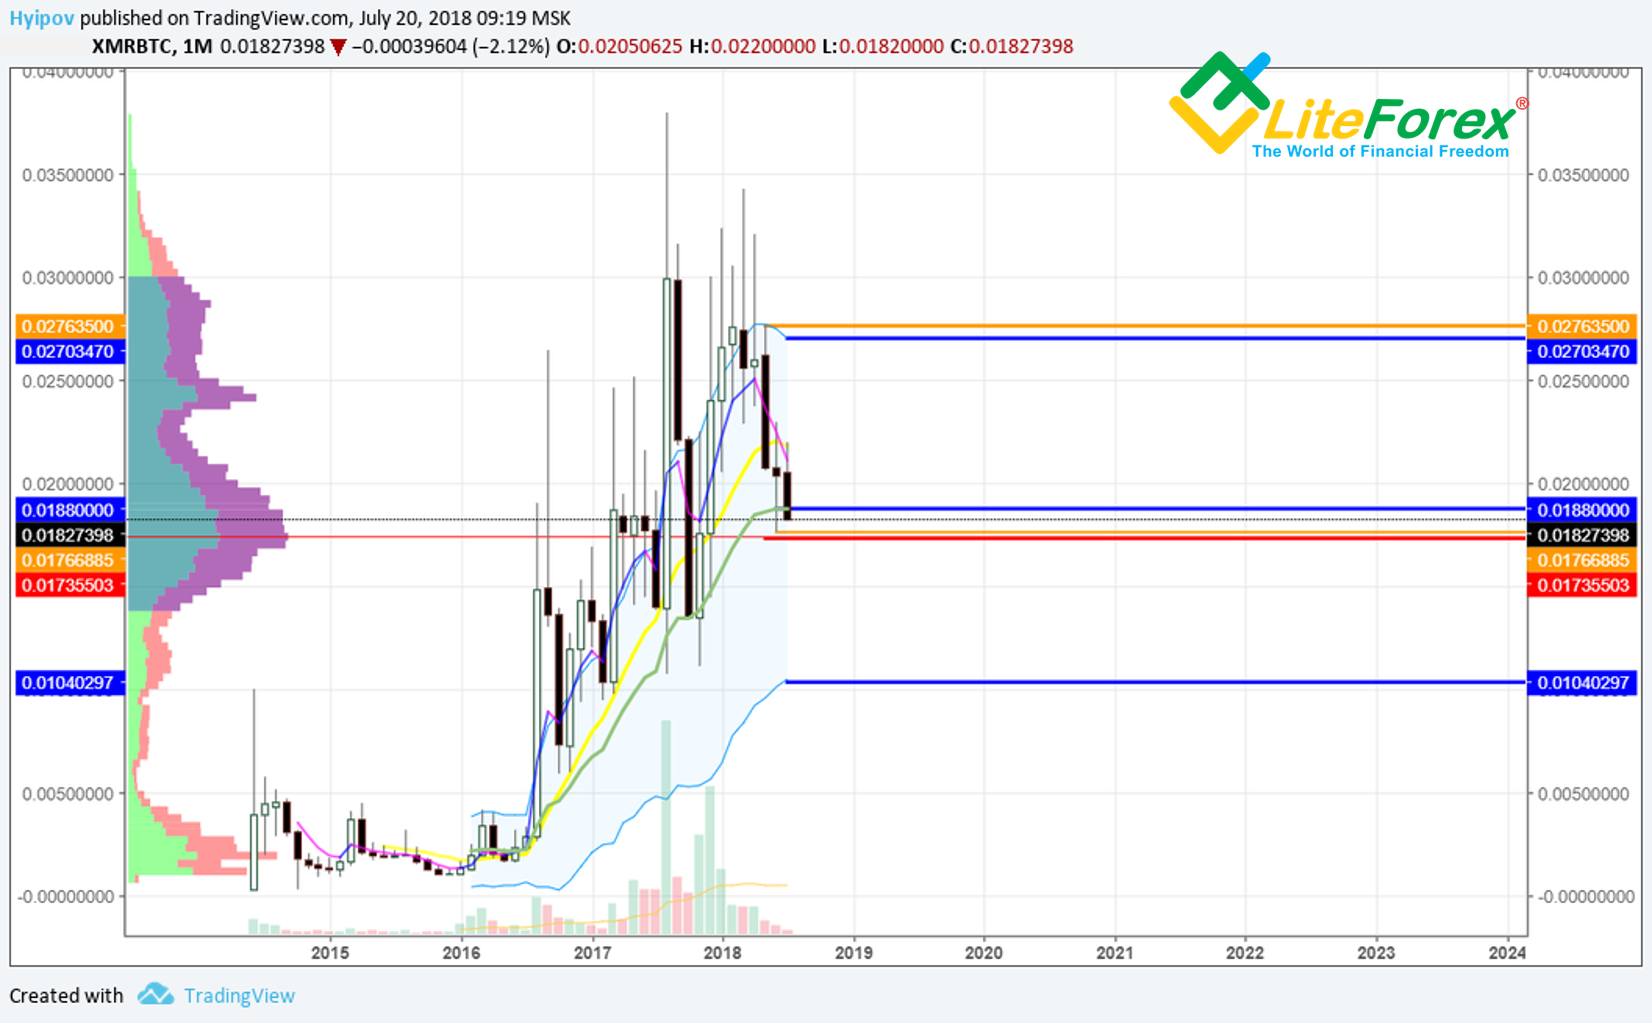
Monero situation is as interesting as that of Zcash. In XMR 1M chart above, you see that point of control in the volume profile (the red line) is close to Keltner channel’s moving average and June’s low (orange line).
In combination, all these levels form the XMR ticker support zone and create a strong barrier to moving down.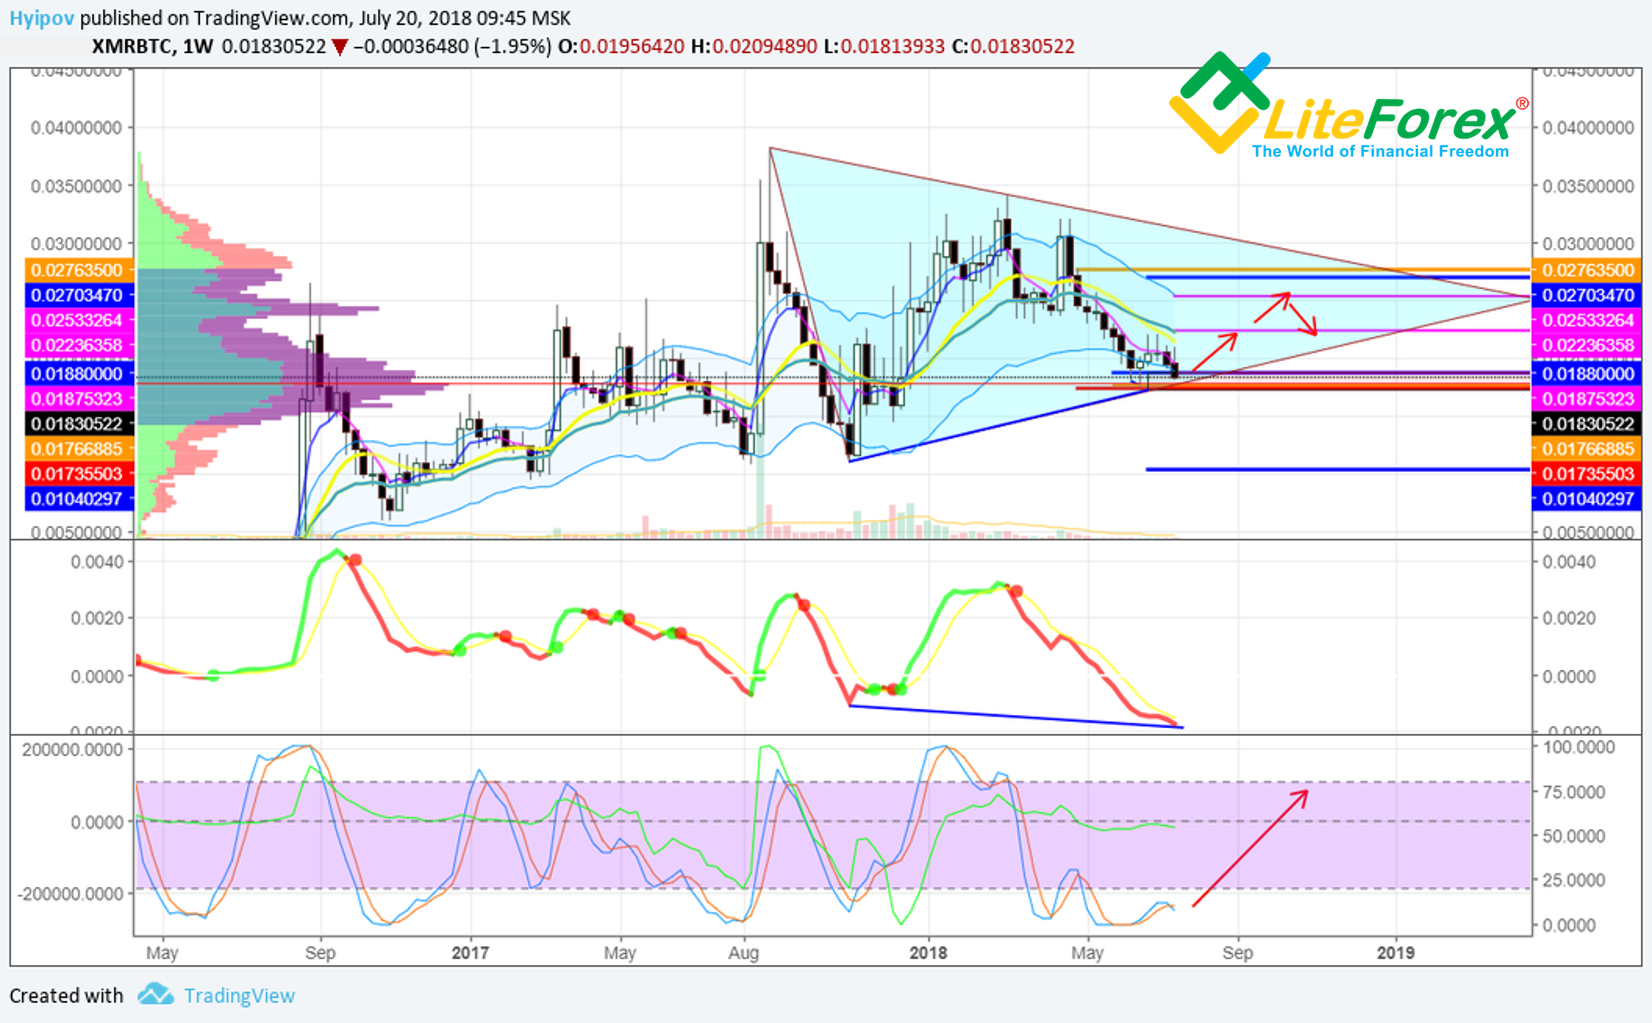
In XMR 1-week chart, it looks like ZEC. XMR ticker is also In the sideways trend inside the equilateral triangle. However, Monero, unlike Zcash, has closely approached the figure’s borders. Therefore, it is more convenient to enter there, as you can put stops very close.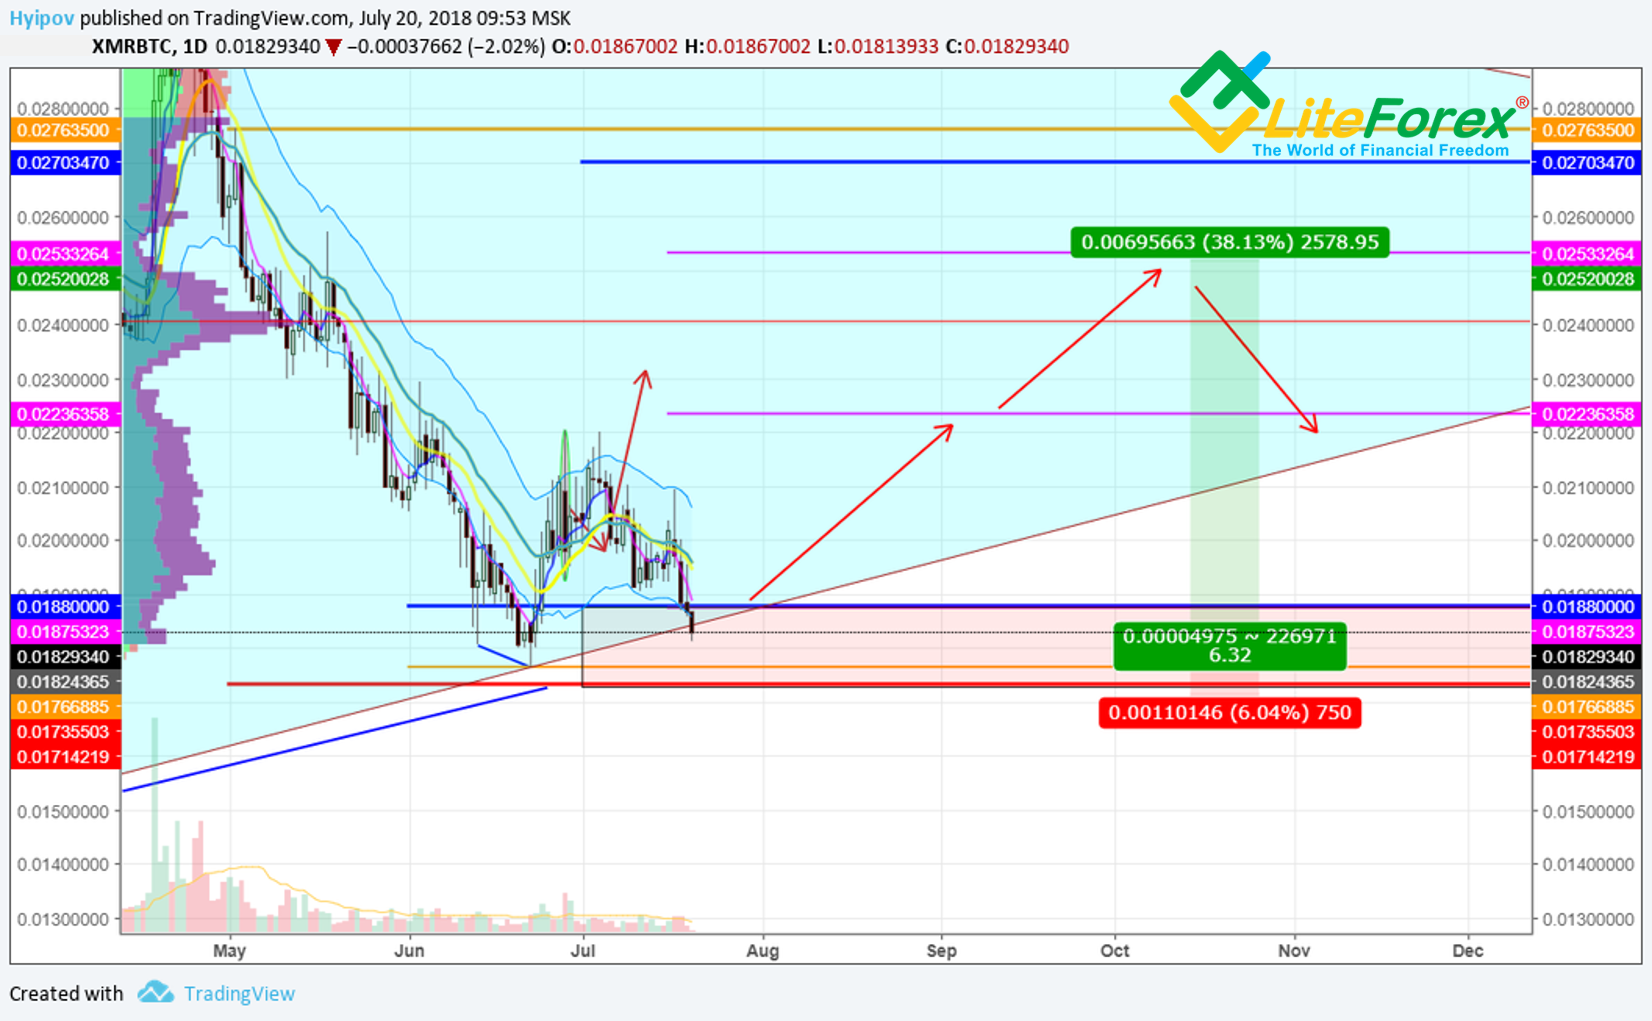
In XMR 1D chart, the situation is clearer. The ticker has broken out the triangle's bottom leg and is now in the support zone. The bottom support border is the level of this month’s low at 0.0176 BTC; next, there is the point of control at 0.0173. If Monero price goes below the level, the bullish scenario will be canceled, so, you can safely put a stop beyond this border.
Targets to take profits can be set at Keltner channel’s key levels.
Currently, the first XMR target is at around 0.0223 BTC, where there is channel's balance level in the 1-week timeframe; the second target is at 0.0253 BTC, the channel's top border.
Finally, entering at the current levels is already promising quite a good risk/profit ratio, 6.32 to 1.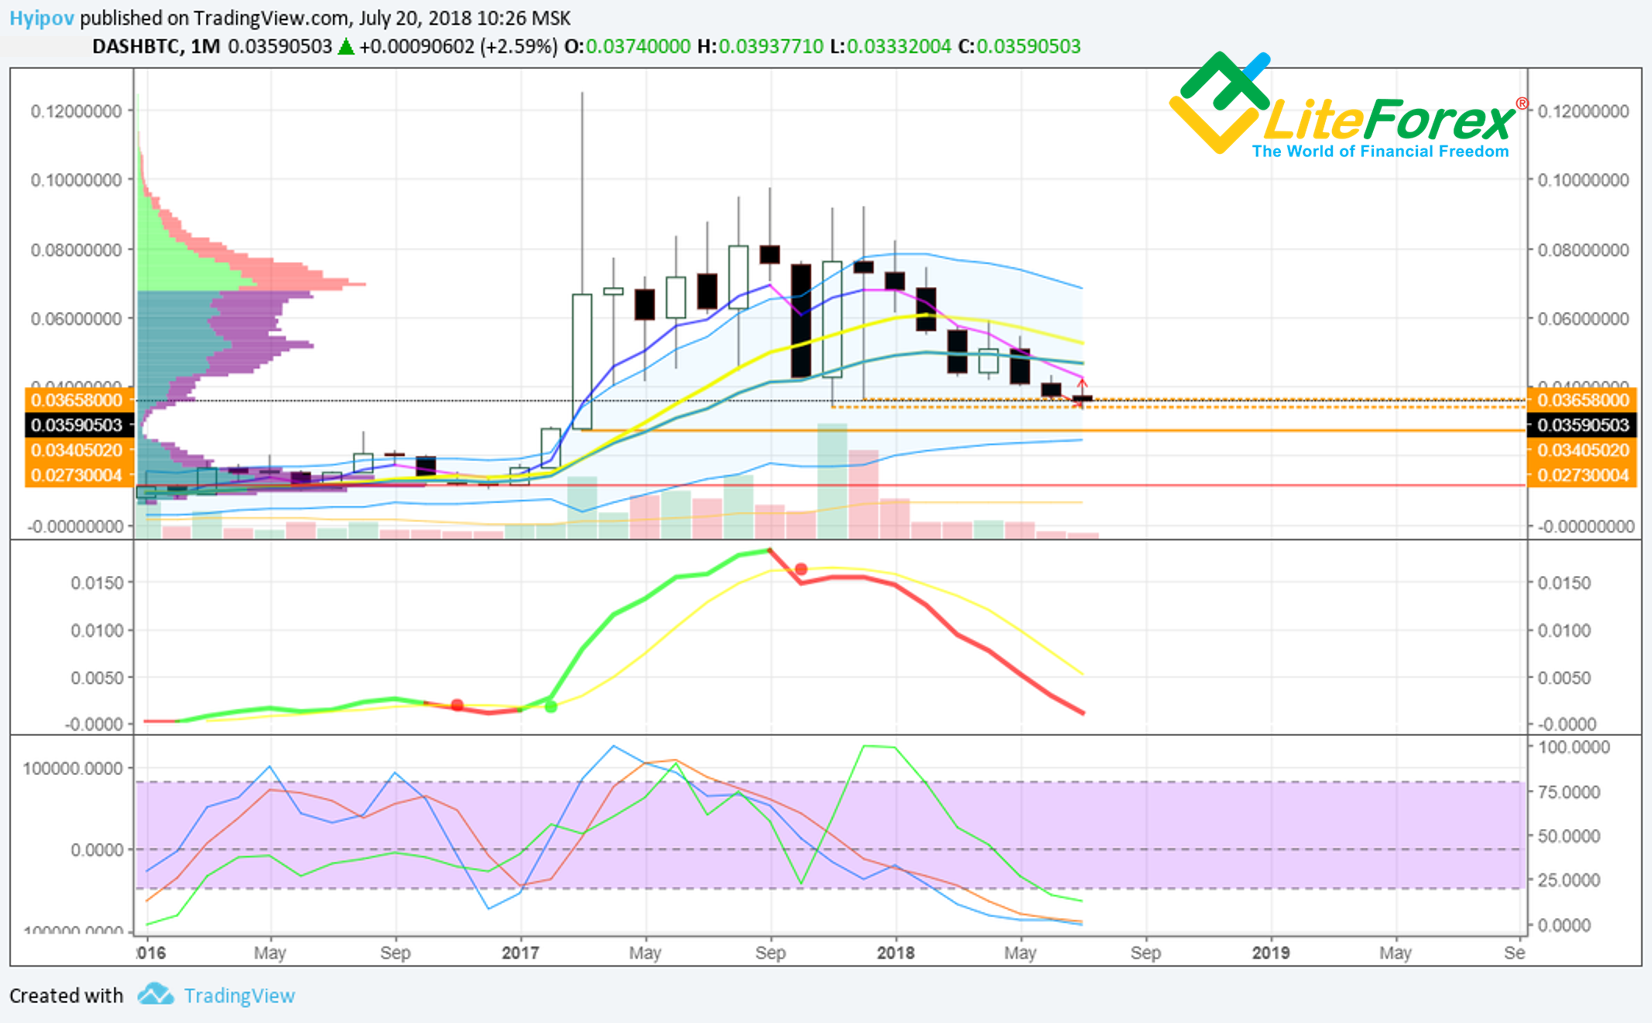
As it is clear from Dash price chart above, Dash price has already broke through all its key levels, market at the lows of November and December, 2017. In general, oscillators are bearish, which suggests a potential for falling down towards Keltner channel's bottom border and March’s low at 0.0273 BTC.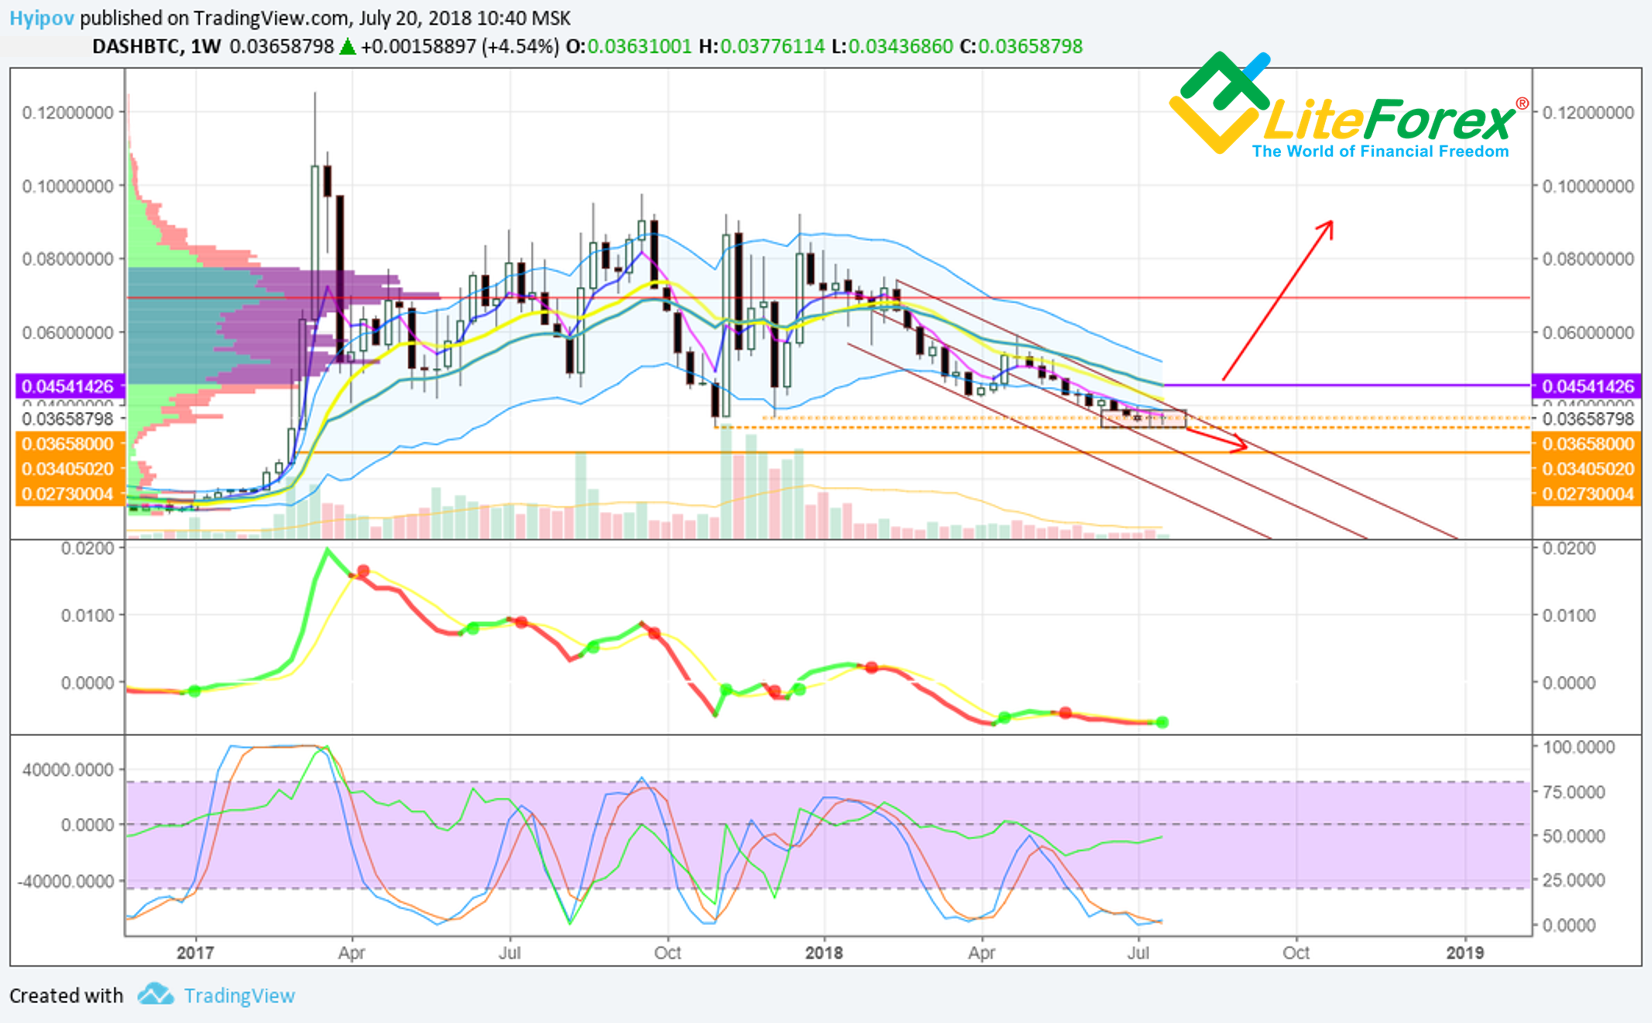
In DASHBTC 1W chart, the ticker is trading inside the bearish channel. Now, it is pausing in the range of 0.036 – 0.034 due to the above key levels. However it is not a pivot sign, but just a moment for Dash to make a pause and leave the overbought zone.
DASH ticker is really likely to go down within the next month. And the scenario can change to bullish only if the ticker breaks through Keltner channel's moving average that is currently at 0.0454 BTC.
Summary
Analyzing the anonymous coins market and comparing it to the general cryptocurrency trend, we see that this segment is traded with a large discount. However, it is moving in the general cryptocurrency market trend.
Analysis of each separate coin suggests that the situation, related to the market, is not the final verdict. Although ZEC performs the best in general, Monero is better for short-term trading.
DASH situation is the worst. It can’t even consolidate at lows of the recent 12 months, which suggests its general weakness and lack of support from big crypto traders.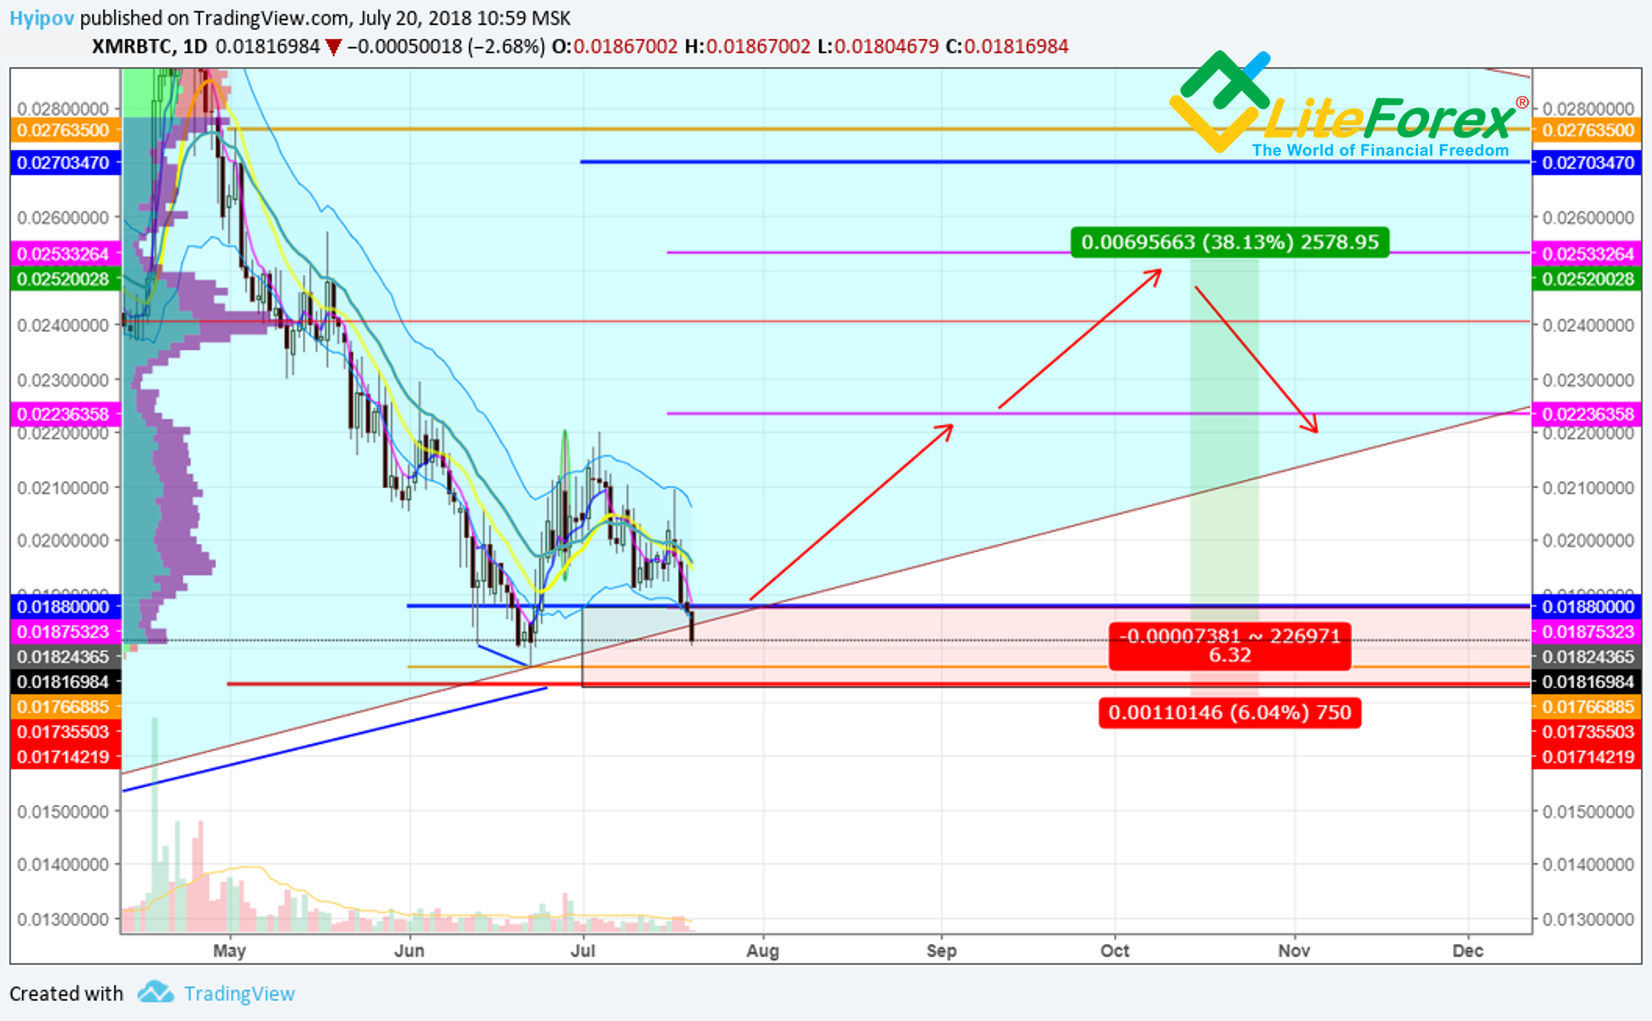
Finally, from all the three confidential altcoins analyzed, I can suggest soon purchases only for XMR/BTC, due to good profit/risk ratio. Here, I’d like to emphasize that you should enter not exactly now, but only after there is a clear support from buyers. I mean, you should wait until there is a doji with growing volume, or another Japanese candlestick pattern, suggesting the local trend reversal.
XMR/BTC buy zone is 0.0183 – 0.176.
SL is below 0.0173.
Targets to take profits are around 0.022 BTC and 0.025 BTC.
