XLF Put Players Strike As Bank Stocks Retreat

Published 05/30/2018, 02:06 AM
US10YT=X
-
XLF
-

Bank stocks are crumbling today as geopolitical uncertainty boosts bond prices. Most recently, the 10-year Treasury yield was down 4.2% at 2.81%, while the Financial Select Sector SPDR (NYSE:XLF) has plunged 3.7% to trade at $26.80. The drop has sparked a rush of activity in XLF's options pits, with most of the action occurring on the put side of the aisle.

Specifically, 180,589 puts and 148,366 calls have changed hands on XLF so far today -- nearly three times what's typically seen at this point, and total options volume pacing in the 95th annual percentile. Most active are the July 26 put and 28 call, where data from Trade-Alert suggest one speculator may be closing out of a risk-reversal, or synthetic long, strategy.

Elsewhere, the weekly 6/1 27-strike put has garnered notable interest, with more than 14,000 contracts traded. New positions are being initiated here, and it looks like some of that activity could be of the sell-to-open kind. If this is the case, the put writers expect XLF to hold near $27 through expiration at this Friday's close.

They could also be betting on a volatility crush -- which would make it cheaper to buy back the options they sold. The implied volatility term structure on these weekly 6/1 options is currently at 28.06%, versus 20.39% for standard June options.

Whatever the reason, XLF has tended to reward premium sellers over the past year, per its Schaeffer's Volatility Scorecard (SVS) reading of 25. In other words, the fund has underperformed over the last 12 months, relative to what the options market has priced in.

Looking closer at the charts, today's slide has XLF shares on track to close below their 200-day moving average for just the third time in the past 12 months. The fund has been in a channel of lower highs since topping out at a 10-year peak north of $30 in late January. What's more, XLF is on track for a fourth straight monthly loss -- the longest such losing streak since 2011.
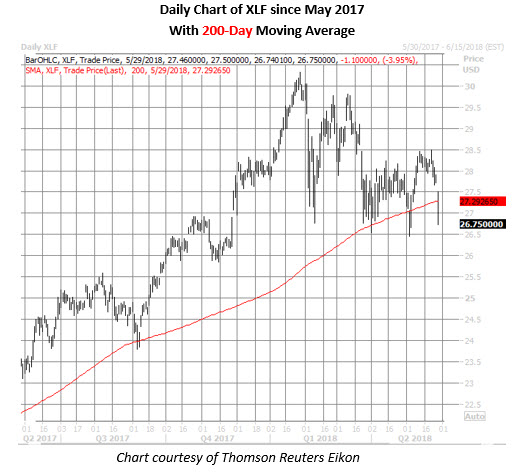
XLF Daily Chart May 29

Latest comments

Loading next article…
Risk Disclosure: Trading in financial instruments and/or cryptocurrencies involves high risks including the risk of losing some, or all, of your investment amount, and may not be suitable for all investors. Prices of cryptocurrencies are extremely volatile and may be affected by external factors such as financial, regulatory or political events. Trading on margin increases the financial risks.
Before deciding to trade in financial instrument or cryptocurrencies you should be fully informed of the risks and costs associated with trading the financial markets, carefully consider your investment objectives, level of experience, and risk appetite, and seek professional advice where needed.
Fusion Media would like to remind you that the data contained in this website is not necessarily real-time nor accurate. The data and prices on the website are not necessarily provided by any market or exchange, but may be provided by market makers, and so prices may not be accurate and may differ from the actual price at any given market, meaning prices are indicative and not appropriate for trading purposes. Fusion Media and any provider of the data contained in this website will not accept liability for any loss or damage as a result of your trading, or your reliance on the information contained within this website.
It is prohibited to use, store, reproduce, display, modify, transmit or distribute the data contained in this website without the explicit prior written permission of Fusion Media and/or the data provider. All intellectual property rights are reserved by the providers and/or the exchange providing the data contained in this website.
Fusion Media may be compensated by the advertisers that appear on the website, based on your interaction with the advertisements or advertisers.
© 2007-2025 - Fusion Media Limited. All Rights Reserved.