XLF Crash Set-Up
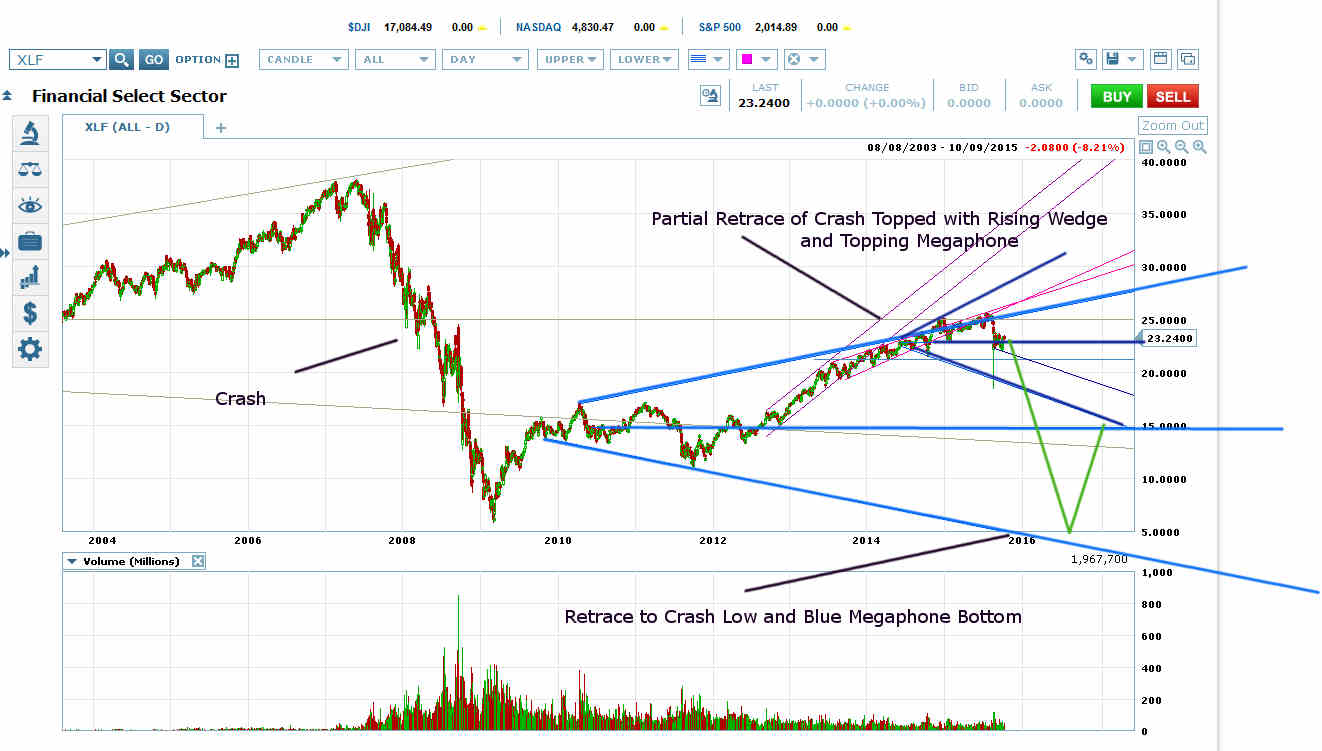
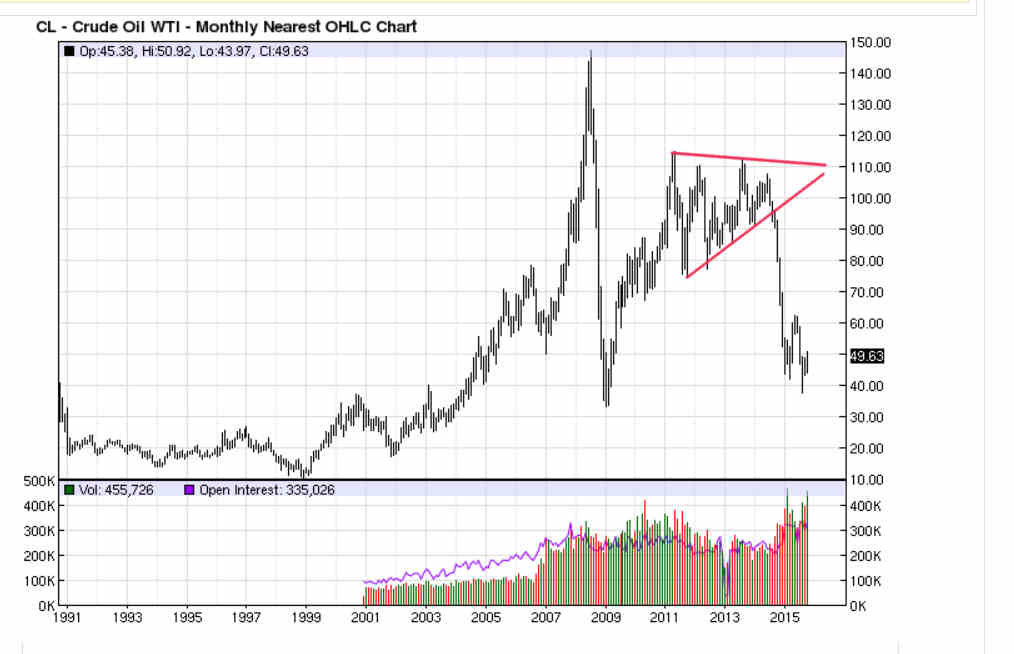
NYSE:XLF has the same crash set-up on its long-term chart as oil had at its 2011 high.
Here’s the set-up: After a big crash, a price retraces roughly 50-70%. (XLF has put in a 62% retrace of its crash out of its 2007 high.)
The price then puts in a prolonged topping formation before a crash back to the original crash low. Here’s how the set-up played out on oil:

Oil Put in a Partial Retrace of its Crash Out of its 2008 High, then Crashed Back to the 2009 Low
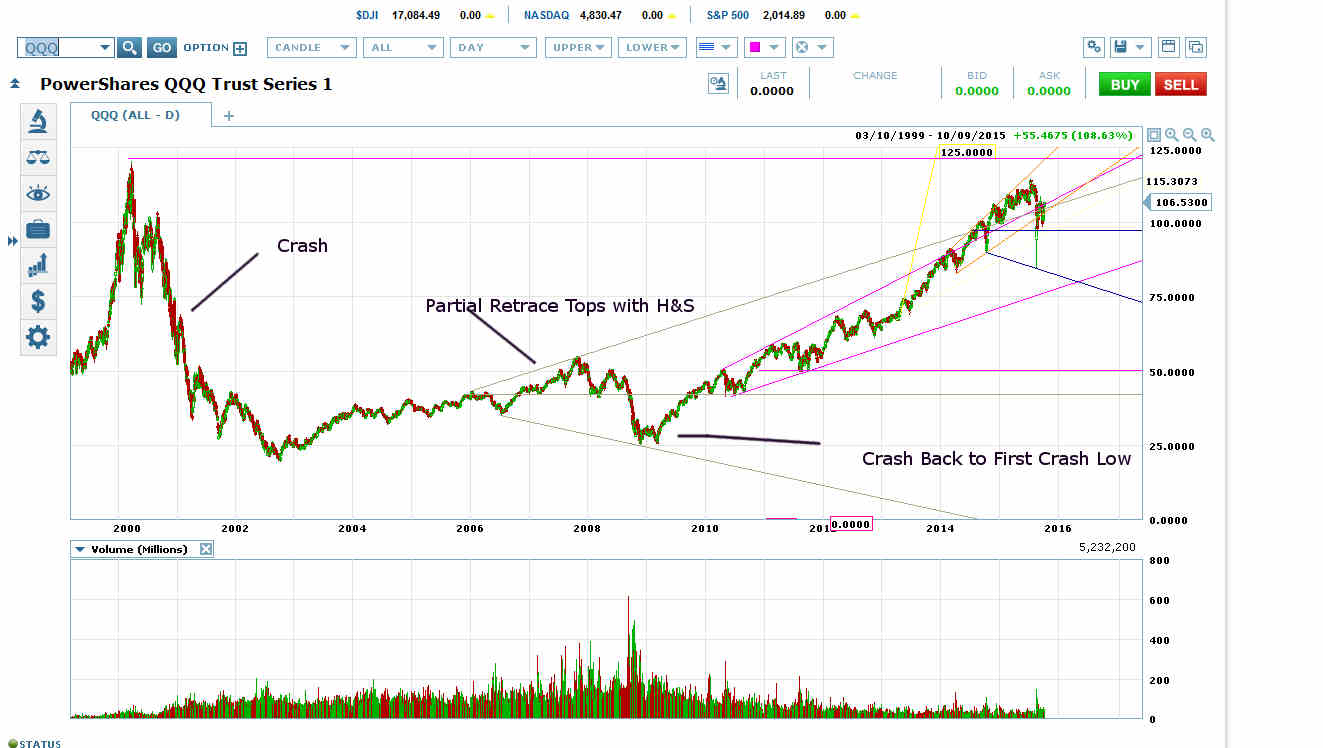
Here’s the same set-up on NASDAQ:QQQ after the crash of the dot-com bubble:

Same Crash Set-Up on QQQ After Crash Out of Dot-Com Bubble
There are lots of examples out there on all kinds of trading instruments and all kinds of time frames.
After its crash into the 2009 low, XLF put in the classic partial retrace and then started working on a rising wedge top in August 2013. It started a megaphone top for the rising wedge in June 2014.
That megaphone top would be expected to retrace to its VWAP, put in a topping pattern there, and then break out downwards into a crash back to the 2009 low and blue megaphone bottom (top chart).
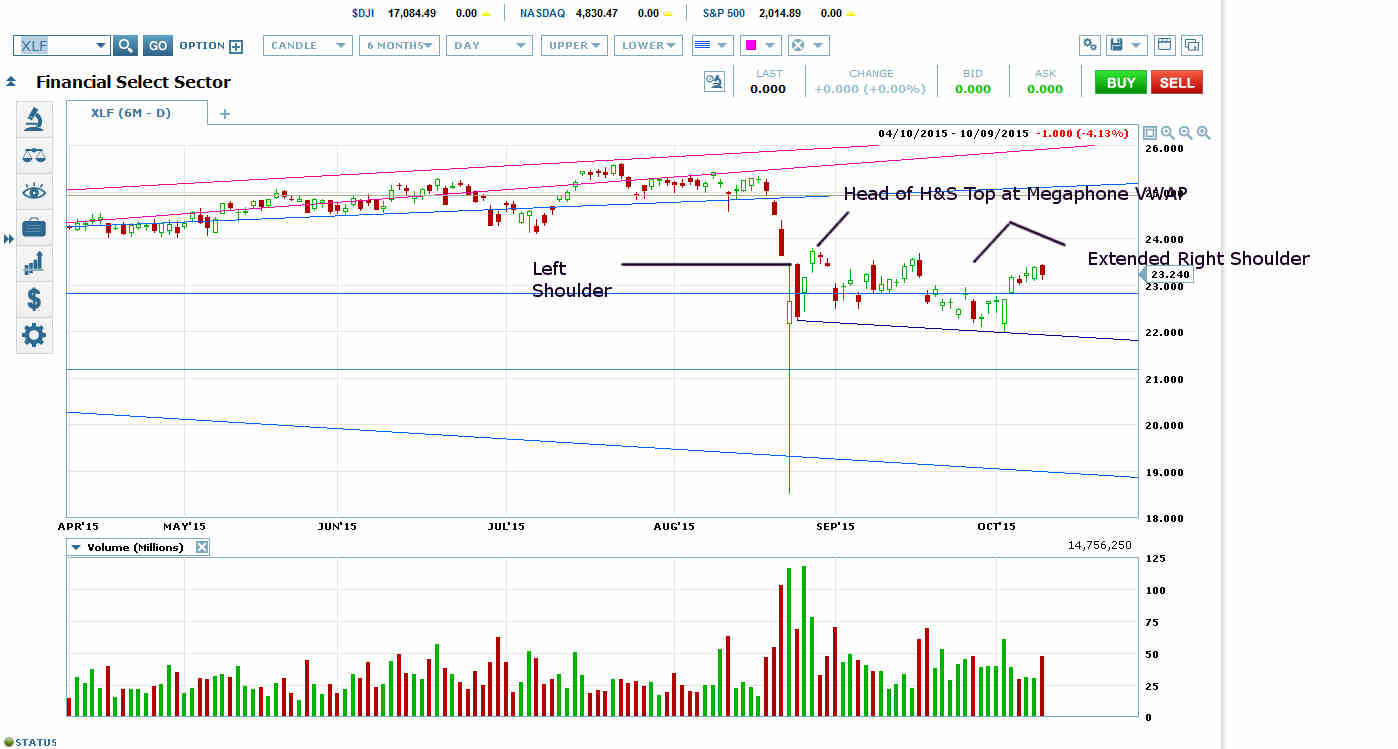
And XLF is in fact completing an H&S top at its blue megaphone VWAP:

XLF H&S Top at Blue Megaphone VWAP Before Breaking Out in Crash to 2009 Low
Note that XLF has the same crash set-up on its 60-minute chart for the crash into the August 24 low.
You see this type of set-up when a price doesn’t properly bottom after a crash. When bulls are too eager to buy the dip, for whatever reason, the price isn’t allowed to put in a proper consolidation, even though the problems that led to the original crash are unlikely to have been solved as fast as the price bounce indicates.
So the price returns to the low.
