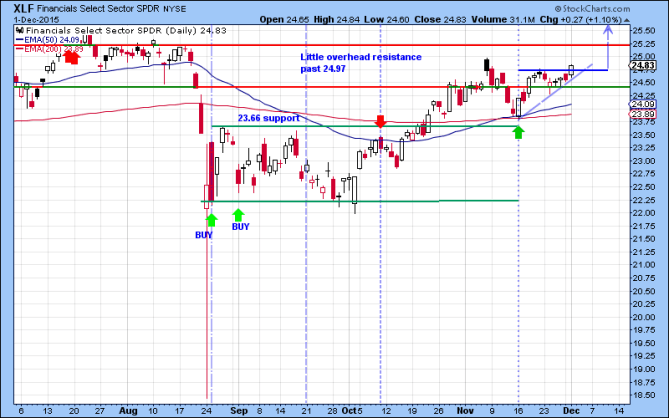
Most of the markets and sectors were bullish today after breaking above their short-term resistance. N:XLF was no different and was up over 1%. The move upwards was the results of buying pressure with some short-covering as XLF broke above its short-term resistance at 24.76. This level has capped the chop over the last week. Between this resistance level and the rally from November 16th, a Piker BUY signal XLF formed an ascending triangle. This is a technical trading pattern that is defined by an uptrend with a resistance level forming an inverted triangle (Top Gun!). This pattern is a measure moved and with the breakout, it gives a price target of 25.64 above the November highs.

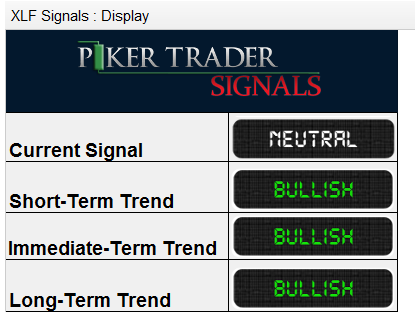
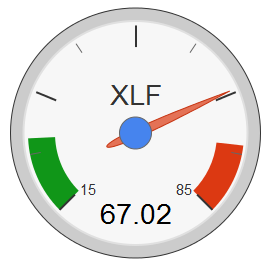
Before XLF can get there, it has to get above the previous resistance at 24.97. This is the high from a few weeks ago but before XLF dipped. More importantly it is the bottom of the base area around the highs from the summer. A strong break of this level and XLF path of lease resistance is upwards. Our indicator for XLF is pointing Bullish and all trends are upwards.

