Energy Select Sector SPDR (NYSE:XLE) has a Potential Sornette Melt-Up Set-Up on its 60-Minute Chart
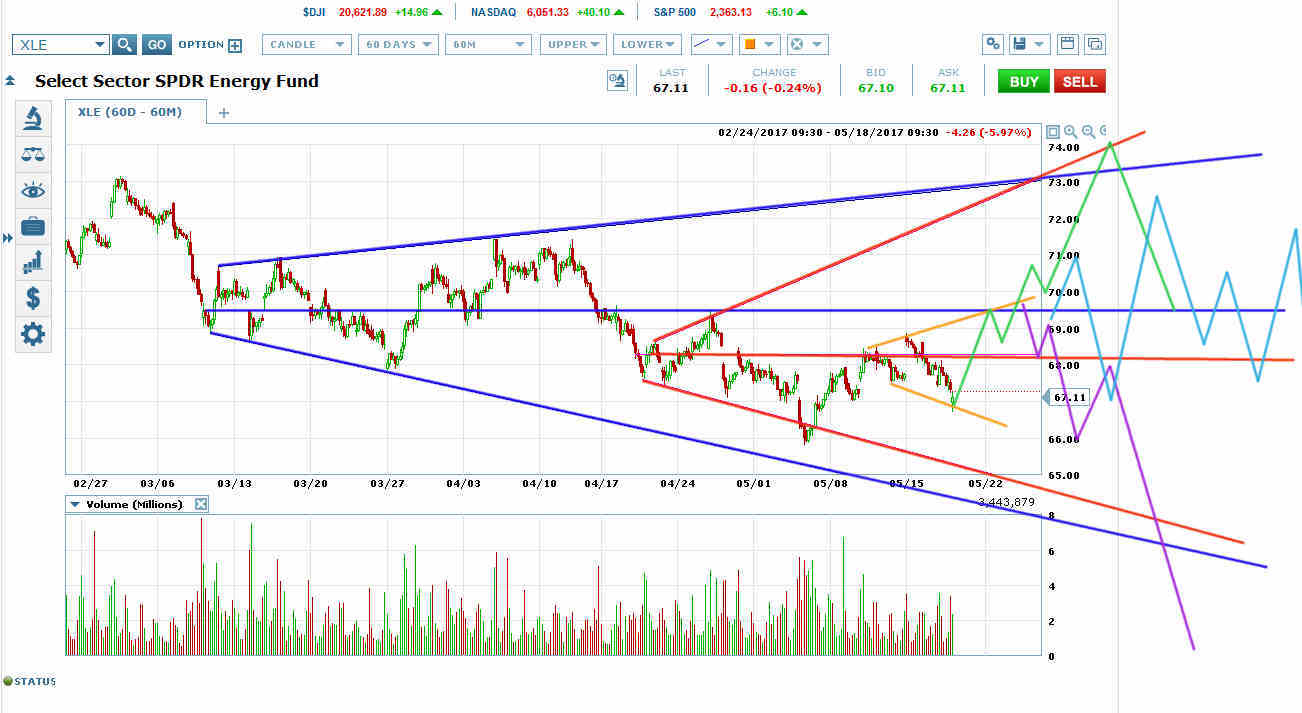
XLE has formed a beautiful megaphone inside a megaphone on its 60-minute chart. Even better, XLE has formed a potential Sornette melt-up launch pattern across VWAP of the red megaphone.
An upwards breakout through the navy blue megaphone VWAP, typically with a double bobble as the orange megaphone fails to retrace to VWAP, would target the red and blue megaphone tops. The move would usually be fast (green scenario).
The light blue scenario represents a series of megaphones inside megaphones across the navy megaphone VWAP. We’d usually see this is a triangle right shoulder is forming on the potential inverse head and shoulders bottom on the daily chart (see below).
The purple scenario represents a top before a collapse back to the 2016 (see below).

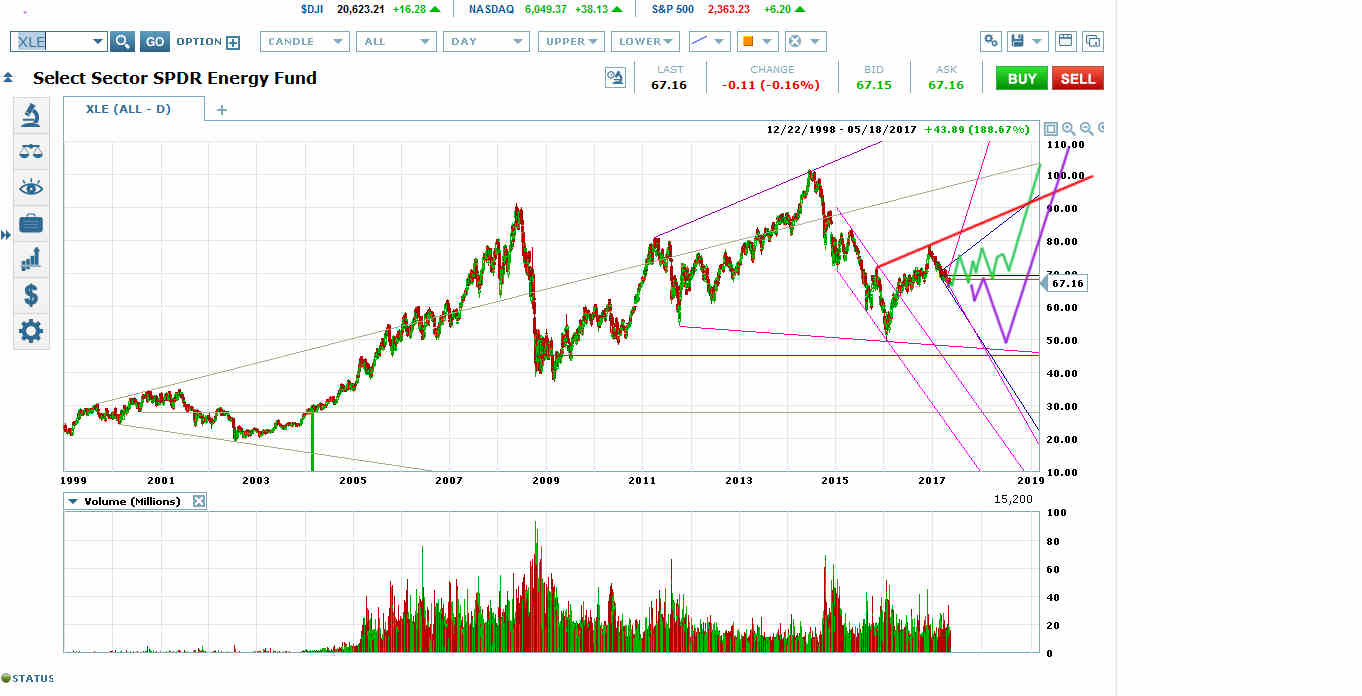
XLE Inverse H&S Bottom with Right Shoulder Triangle vs Neely Set-Up
XLE formed a price channel on its move down from the June 2014 high to the January 2016 low. That kind of move is a Neely set-up for a partial retrace then retest of the low before a melt-up back to the all-time high (purple scenario).
The green scenario on the daily chart is a triangle right shoulder on the inverse H&S before a breakout to retest the all-time high. It’s possible but unlike (because of the megaphones on the 60-minute chart) that XLE will break out of that inverse H&S without a triangle right shoulder.
The Neely set-up is the favorite longer-term.
