For many markets, it feels as if the mid-December Federal Reserve meeting marked a turning point of sorts: that's when the dollar, 10-year treasury yields and oil prices ALL peaked. Despite plenty of risk-on developments, none of those markets have been able to eclipse those mid-December highs.
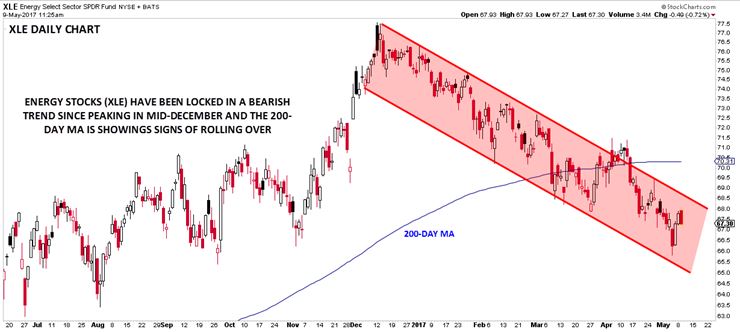
Given the drop in oil prices over the last five months — and especially over the last couple of weeks — it's not surprising that the energy sector has also turned lower since December. As the chart below shows, the sector is trading off around 13% from its peak around $77, despite general strength in the overall stock markets.

Source: Stockcharts.com
The energy sector has been locked in a clear bearish channel over that period, with each minor rally encountering fresh selling pressure. More to the point for longer-term investors, the 200-day moving average is flattening and is at risk of turning lower, suggesting that the long-term trend is shifting in favor of the bears.
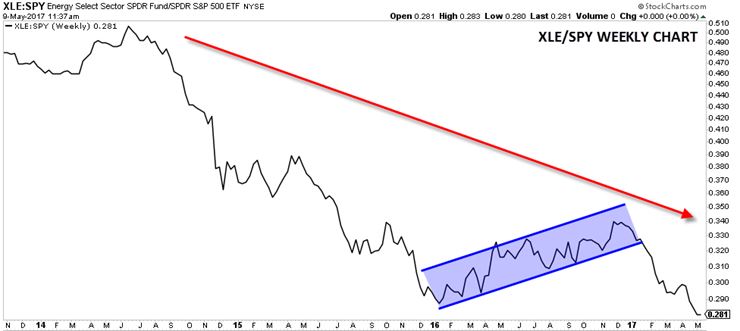
On a relative basis, the picture is arguably even more ominous for bulls. As the sector's weekly chart against the overall market (XLE/SPY) shows, energy stocks have been lagging the overall market for years:

Source: Stockcharts.com
With this year's breakdown from 2016's bearish flag pattern, the long-term underperformance of energy stocks could carry over through 2017 and beyond.
The top holdings in XLE include Exxon Mobil (NYSE:XOM), Chevron (NYSE:CVX), Schlumberger (NYSE:SLB), ConocoPhillips (NYSE:COP), Occidental Petroleum (NYSE:OXY) and Kinder Morgan (NYSE:KMI), all of which are in clear downtrends. We continue to watch for low-risk opportunities to short these names in line with the longer-term bearish trend.
Of course, the outlook for the energy sector, and indeed every sector, is constantly evolving and if the evidence changes, we'll adjust our outlook. For now, though, the path of least resistance for energy stocks remains to the downside.
