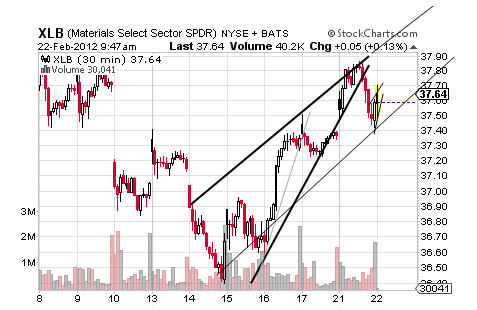
Tuesday the XLB nearly took over its all-important third Bull Fan Line in its daily chart and something that would have put the materials sector in-line with the other S&P sectors and that means a proven reversal of the intermediate-term downtrend born of last August.
“Nearly” is not the same thing, however, as having made that bullish move and in looking at the intraday charts below, it does not look like a strong possibility for the days ahead.
What appears to be a stronger possibility is the XLB fulfilling that tiny and confirmed Bear Pennant to the right that carries a target of about $37.40 and a level that would take the XLB below that that possible Ascending Trend Channel and something that would support the bigger and confirmed Bear Pennant finding its target of $36.40.
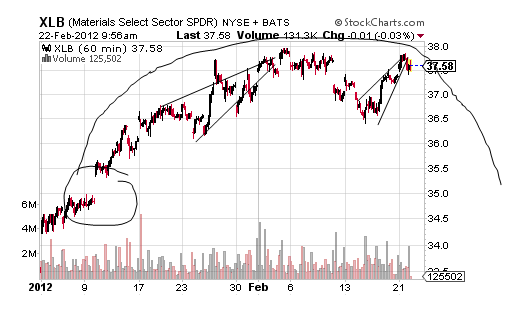
However, if the XLB holds $37.50 or so, there is a chance that its Bear Pennant peaks up a bit higher and right toward $38 before turning down, but the YTD hourly chart suggests that it is more likely that the XLB is going bearish now.
Even more specifically, the chart above suggests that if the XLB does not fall to that tiny Bear P’s target of $37.40 now, it may actually make that breakout above $38 considering there’s not a lot of room in that Rounding Top to accommodate a move to $38 and then back down, but this chart also suggests that this sort of bullishness is unlikely with that unclosed gap at $35.
Put otherwise, the XLB’s YTD hourly chart suggests that the XLB is likely to fall to $37.40, $36.40, $35.00 and then perhaps even to the $33.50 target of that Rounding Top that is showing a nice lower high trend in the current intraday daily form. However, levels should be respected with the single upside level of $38 offsetting this possible downside succession.
- English (UK)
- English (India)
- English (Canada)
- English (Australia)
- English (South Africa)
- English (Philippines)
- English (Nigeria)
- Deutsch
- Español (España)
- Español (México)
- Français
- Italiano
- Nederlands
- Português (Portugal)
- Polski
- Português (Brasil)
- Русский
- Türkçe
- العربية
- Ελληνικά
- Svenska
- Suomi
- עברית
- 日本語
- 한국어
- 简体中文
- 繁體中文
- Bahasa Indonesia
- Bahasa Melayu
- ไทย
- Tiếng Việt
- हिंदी
XLB Continues to Look Bearish
Latest comments
Loading next article…
Install Our App
Risk Disclosure: Trading in financial instruments and/or cryptocurrencies involves high risks including the risk of losing some, or all, of your investment amount, and may not be suitable for all investors. Prices of cryptocurrencies are extremely volatile and may be affected by external factors such as financial, regulatory or political events. Trading on margin increases the financial risks.
Before deciding to trade in financial instrument or cryptocurrencies you should be fully informed of the risks and costs associated with trading the financial markets, carefully consider your investment objectives, level of experience, and risk appetite, and seek professional advice where needed.
Fusion Media would like to remind you that the data contained in this website is not necessarily real-time nor accurate. The data and prices on the website are not necessarily provided by any market or exchange, but may be provided by market makers, and so prices may not be accurate and may differ from the actual price at any given market, meaning prices are indicative and not appropriate for trading purposes. Fusion Media and any provider of the data contained in this website will not accept liability for any loss or damage as a result of your trading, or your reliance on the information contained within this website.
It is prohibited to use, store, reproduce, display, modify, transmit or distribute the data contained in this website without the explicit prior written permission of Fusion Media and/or the data provider. All intellectual property rights are reserved by the providers and/or the exchange providing the data contained in this website.
Fusion Media may be compensated by the advertisers that appear on the website, based on your interaction with the advertisements or advertisers.
© 2007-2025 - Fusion Media Limited. All Rights Reserved.
